EMA100 اور NUPL رشتہ دار غیر حقیقی منافع مقداری تجارتی حکمت عملی

جائزہ
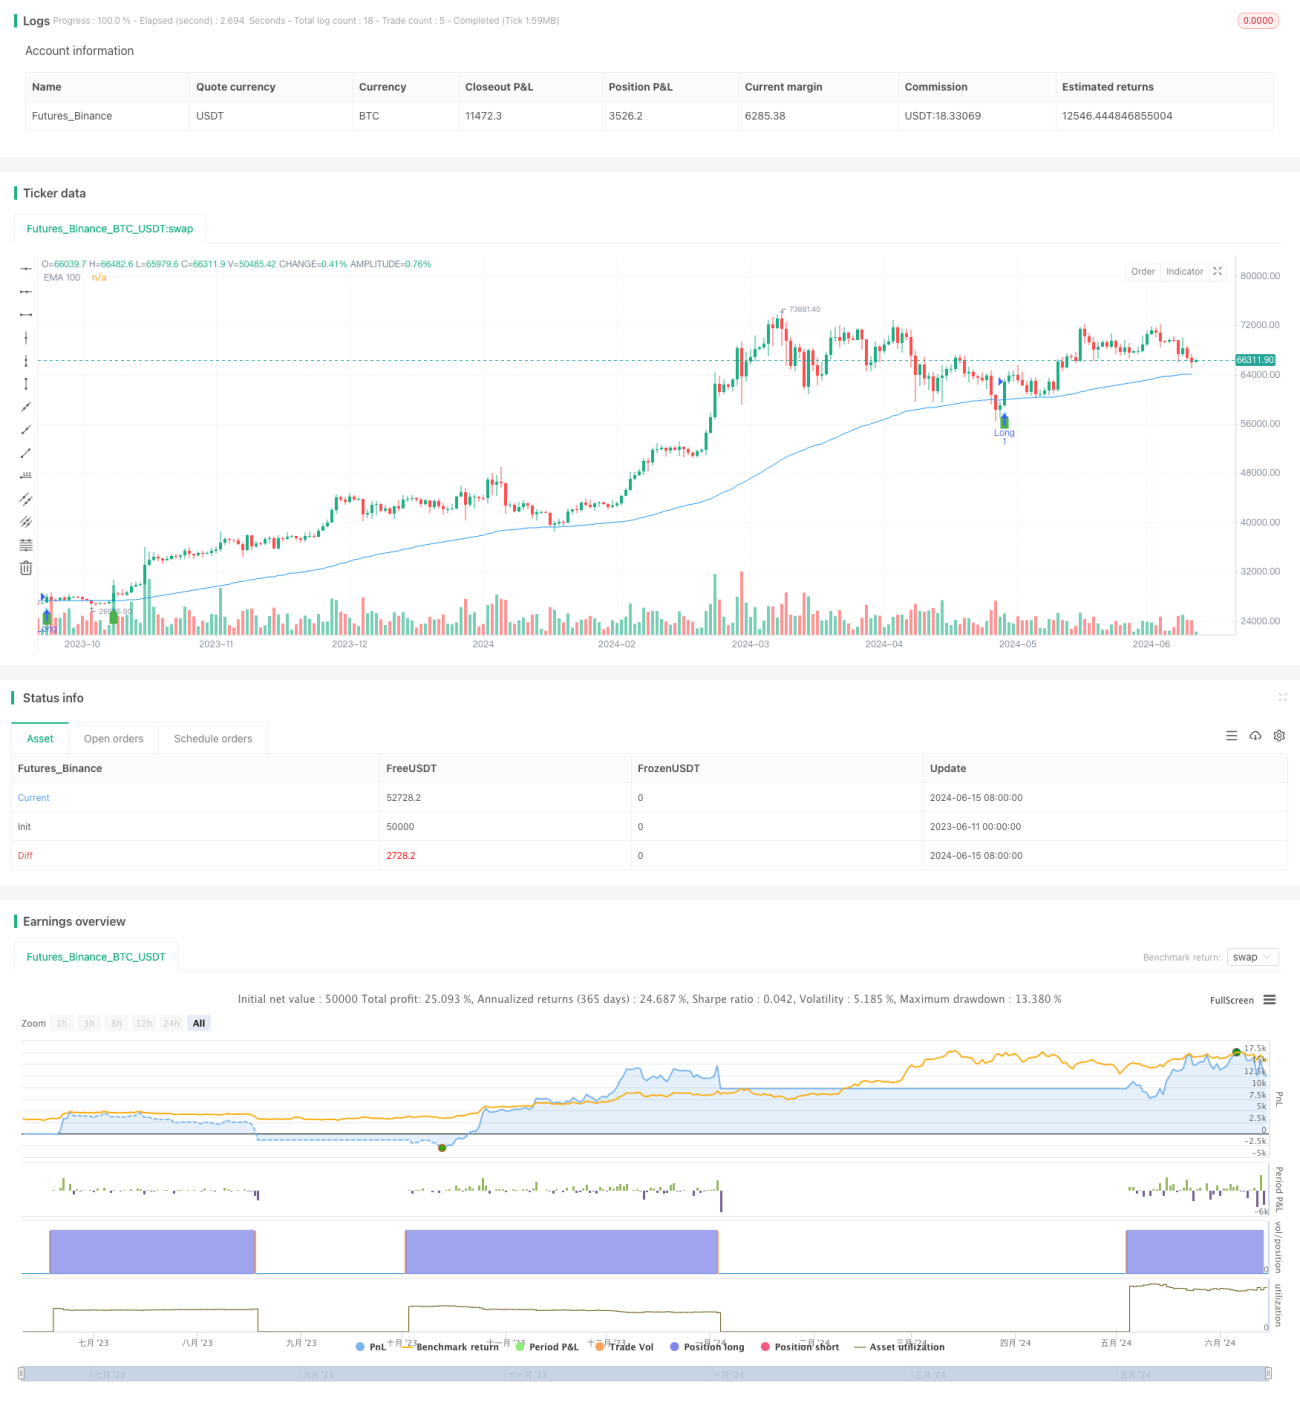
یہ ٹریڈنگ حکمت عملی 100 دورانیہ انڈیکس منتقل اوسط ((EMA100) ، خالص غیر حاصل شدہ منافع / نقصان ((NUPL) ، اور نسبتا غیر حاصل شدہ منافع کے تین اشارے پر مبنی ہے ، جس سے ٹریڈنگ سگنل پیدا ہوتا ہے۔ جب قیمت EMA100 سے ٹکرا جاتی ہے اور NEPL اور نسبتا غیر حاصل شدہ منافع دونوں ٹھیک ہوتے ہیں تو ایک سے زیادہ سگنل کو متحرک کیا جاتا ہے۔ جب قیمت EMA100 سے ٹکرا جاتی ہے اور NEPL اور نسبتا غیر حاصل شدہ منافع دونوں منفی ہوتے ہیں تو ایک خالی سگنل کو متحرک کیا جاتا ہے۔ یہ حکمت عملی 10٪ فکسڈ پوزیشن لیتا ہے ، اور 10٪ اسٹاپ نقصان کا تعین کرتا ہے۔
حکمت عملی کا اصول
- 100 سائیکل ای ایم اے کو رجحانات کے اہم اشارے کے طور پر شمار کرنا
- رجحان کی طاقت اور پائیداری کی تصدیق کے لئے NUPL اور رشتہ دار غیر منافع بخش منافع کو معاون اشارے کے طور پر استعمال کرنا
- جب قیمت EMA100 کے اوپر / نیچے سے گزرتی ہے تو ، NUPL اور رشتہ دار غیر منافع بخش منافع ایک ساتھ ہی مثبت / منفی وقت کے لئے زیادہ / کم سگنل پیدا کرتے ہیں
- 10٪ فکسڈ پوزیشن کا استعمال کرتے ہوئے اور 10٪ روکنے کے لئے، خطرے کو کنٹرول
- جب ایک ہیڈ پوزیشن کی پوزیشن ہوتی ہے تو ، اگر قیمت اسٹاپ نقصان کی قیمت سے نیچے آجاتی ہے تو ، ایک ہیڈ پوزیشن کو ختم کردیا جاتا ہے۔ جب ایک ہیڈ پوزیشن کی پوزیشن ہوتی ہے تو ، اگر قیمت اسٹاپ نقصان کی قیمت سے اوپر آجاتی ہے تو ، ایک ہیڈ پوزیشن کو ختم کردیا جاتا ہے۔
طاقت کا تجزیہ
- سادہ اور سمجھنے میں آسان: حکمت عملی کی منطق واضح ہے ، عام تکنیکی اشارے استعمال کیے گئے ہیں ، اور اسے سمجھنا اور اس پر عمل درآمد کرنا آسان ہے
- رجحانات کا سراغ لگانا: ای ایم اے 100 کے ذریعہ اہم رجحانات پر قبضہ کرنا ، رجحانات کی منڈیوں میں استعمال کے لئے موزوں ہے
- رسک کنٹرول: فکسڈ پوزیشن اور اسٹاپ نقصان کی ترتیب ، جو خطرے کو مؤثر طریقے سے کنٹرول کرسکتی ہے
- لچکدار: حکمت عملی مختلف مارکیٹوں اور ٹریڈ مارکوں پر لاگو ہوسکتی ہے
خطرے کا تجزیہ
- غلط سگنل: ہلچل والی مارکیٹوں میں ، قیمتوں کے EMA100 کے ساتھ کثرت سے کراسنگ سے زیادہ غلط سگنل پیدا ہوسکتے ہیں ، جس سے نقصان ہوتا ہے۔
- تاخیر: ای ایم اے ایک تاخیر سے چلنے والا اشارے ہے ، جو رجحان میں تبدیلی کے وقت سست رد عمل کا شکار ہوسکتا ہے ، بہترین داخلے کے وقت سے محروم ہوسکتا ہے
- پیرامیٹرز کی اصلاح: حکمت عملی کے پیرامیٹرز (جیسے ای ایم اے کا دورانیہ ، پوزیشن کا سائز ، اسٹاپ نقصان کا تناسب) کو مختلف مارکیٹوں کے مطابق بہتر بنانے کی ضرورت ہے ، اور نامناسب پیرامیٹرز حکمت عملی کی ناکامی کا سبب بن سکتے ہیں۔
اصلاح کی سمت
- پیرامیٹرز کی اصلاح: حکمت عملی کی کارکردگی کو بہتر بنانے کے لئے ای ایم اے کی مدت ، پوزیشن کا سائز ، اسٹاپ نقصان کا تناسب وغیرہ جیسے پیرامیٹرز کو بہتر بنائیں
- فلٹر سگنل: دوسرے تکنیکی اشارے یا مارکیٹ کے جذبات کے اشارے شامل کریں ، جعلی سگنل کو فلٹر کریں
- متحرک پوزیشن مینجمنٹ: مارکیٹ میں اتار چڑھاو ، اکاؤنٹ میں نقصان اور دیگر عوامل کے مطابق پوزیشنوں کو متحرک طور پر ایڈجسٹ کریں ، منافع میں اضافہ کریں اور خطرے پر قابو پالیں
- کثیر خلائی پورٹ فولیو: ایک ہی وقت میں کثیر اور خالی سر پوزیشنیں ، مارکیٹ کے خطرات کا احاطہ ، حکمت عملی میں استحکام کو بہتر بنانا
خلاصہ کریں۔
یہ تجارتی حکمت عملی EMA100 ، NUPL اور نسبتا unrealized منافع کے تین اشارے کے ذریعہ تجارتی سگنل پیدا کرتی ہے ، جس میں منطقی وضاحت ، خطرے سے قابو پانے ، اور مضبوط موافقت جیسے فوائد ہیں۔ اس کے ساتھ ہی غلط سگنل ، پسماندگی اور پیرامیٹرز کی اصلاح جیسے خطرات بھی موجود ہیں۔ مستقبل میں اس حکمت عملی کو پیرامیٹرز کی اصلاح ، سگنل فلٹرنگ ، متحرک پوزیشن مینجمنٹ اور کثیر خلائی مجموعہ جیسے طریقوں سے بہتر اور بہتر بنایا جاسکتا ہے۔
- 1