EMA متحرک سٹاپ نقصان ٹریڈنگ حکمت عملی

جائزہ
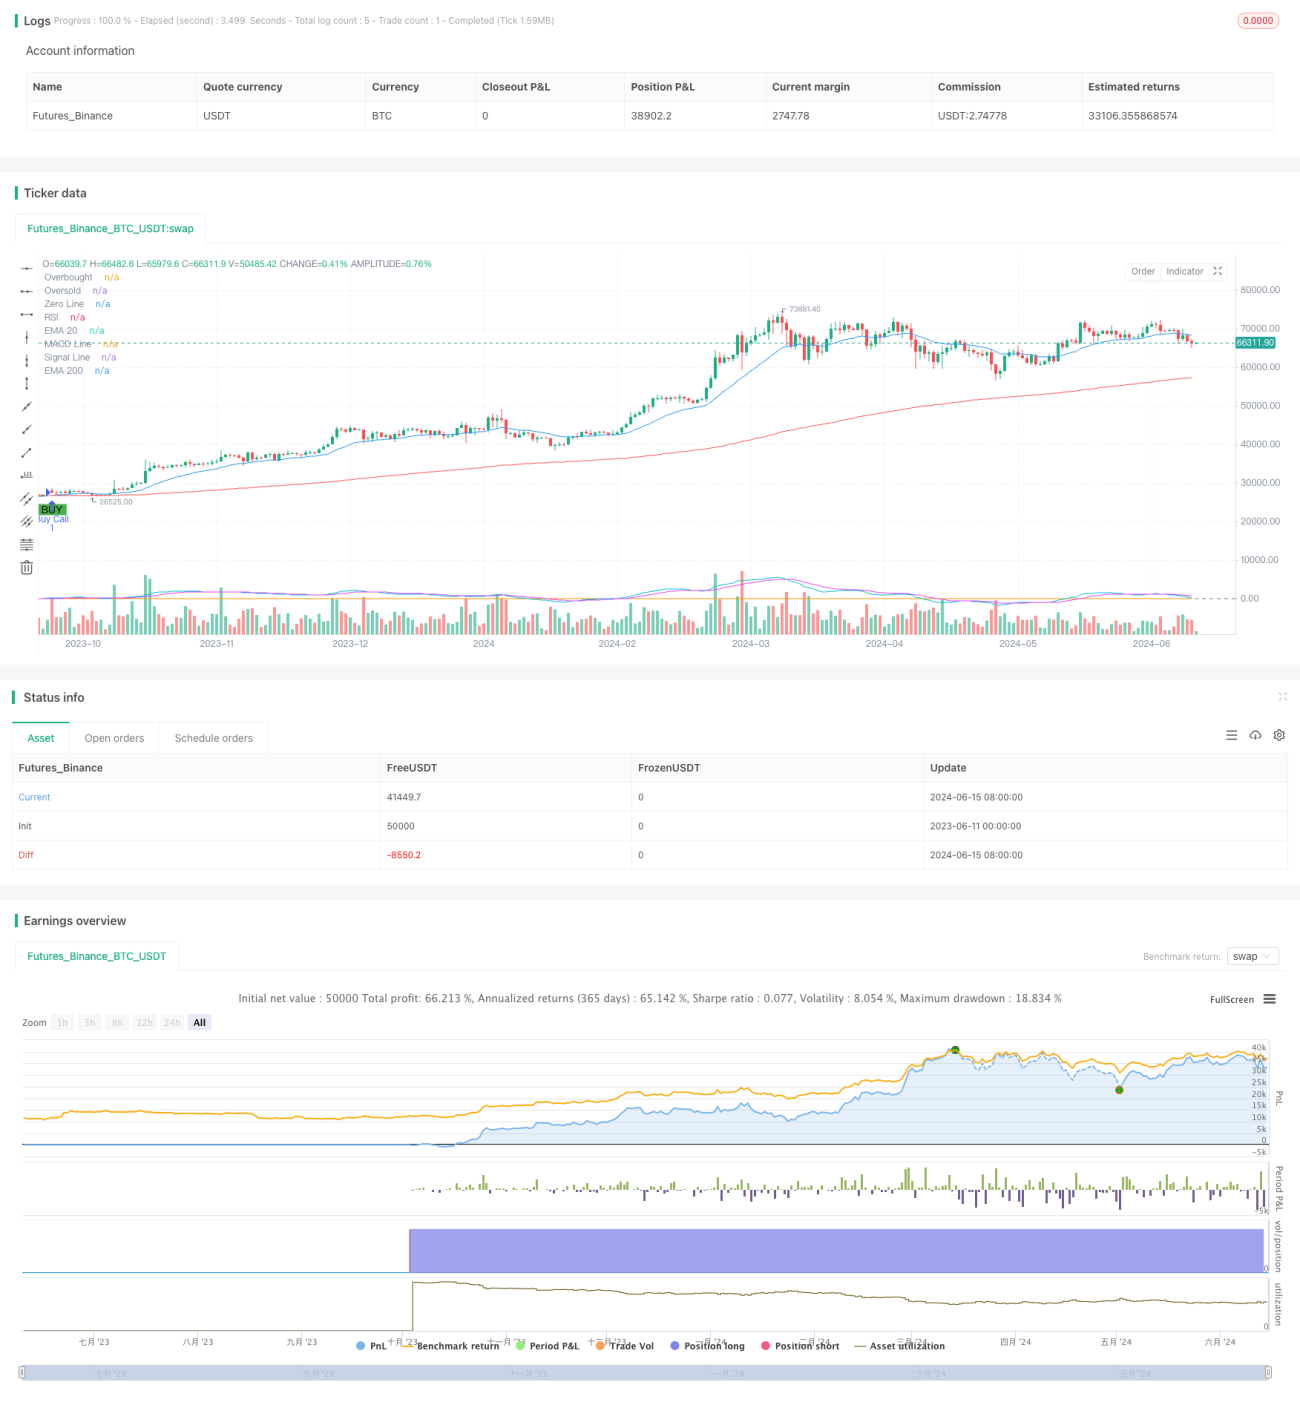
یہ حکمت عملی 20 دن اور 200 دن کے انڈیکس کے متحرک اوسط ((EMA) کے کراس سگنل پر مبنی ہے اور خرید و فروخت کے اشارے پیدا کرنے کے لئے نسبتا weak مضبوط اشارے ((RSI) اور متحرک اوسط اختتام پھیلنے والے اشارے ((MACD) کے ساتھ مل کر تصدیق کی جاتی ہے۔ اس کے ساتھ ہی ، حکمت عملی تجارتی خطرات کو منظم کرنے اور منافع کو مقفل کرنے کے لئے متحرک اسٹاپ نقصان اور فکسڈ ٹارگٹ منافع کے طریقہ کار کو اپناتی ہے۔
حکمت عملی کا اصول
- 20 دن اور 200 دن کے EMA کا حساب لگائیں ، جب 20 دن کے EMA پر 200 دن کا EMA ہوتا ہے تو خریدنے کا اشارہ ہوتا ہے۔ جب 20 دن کے EMA کے نیچے 200 دن کا EMA ہوتا ہے تو فروخت کا اشارہ ہوتا ہے۔
- RSI اور MACD کو EMA کراس سگنل کی تصدیق کے لئے استعمال کیا جاتا ہے۔ خرید صرف اس وقت کی جاتی ہے جب RSI 50 سے زیادہ ہو اور MACD لائن سگنل لائن سے زیادہ ہو۔ فروخت صرف اس وقت کی جاتی ہے جب RSI 50 سے کم ہو اور MACD لائن سگنل لائن سے کم ہو۔
- مقررہ ہدف منافع کی شرح (مثلاً 20٪) اور ابتدائی سٹاپ نقصان کی شرح (مثلاً 10٪) مقرر کریں۔
- جب ہولڈنگ منافع ہدف منافع کی شرح تک پہنچ جاتا ہے تو ، اسٹاپ نقصان کی قیمت کو موجودہ قیمت کے 10٪ سے کم تک بڑھایا جائے ، جس سے متحرک اسٹاپ نقصان ہوتا ہے۔
- جب قیمت متحرک اسٹاپ نقصان کی قیمت کو چھوتی ہے تو ، موازنہ منافع میں ختم ہوجاتا ہے۔
اسٹریٹجک فوائد
- متعدد تکنیکی اشارے کے ساتھ مل کر ، تجارتی سگنل کی توثیق ، سگنل کی وشوسنییتا میں اضافہ کرتی ہے۔
- متحرک اسٹاپ نقصان کا استعمال کرتے ہوئے ، منافع کو مقفل کرتے ہوئے ، قیمتوں کو کچھ پیچھے ہٹنے کی گنجائش دیں ، اور جلد سے جلد صفائی سے بچیں۔
- ایک مقررہ ہدف منافع کی شرح کا تعین جو خطرے کو کنٹرول کرنے اور مستحکم منافع حاصل کرنے میں مدد کرتا ہے۔
اسٹریٹجک رسک
- ای ایم اے کراس سگنل میں اکثر غلط سگنل ہوسکتے ہیں ، جس کی وجہ سے تجارت کی لاگت میں اضافہ ہوتا ہے۔
- اس حکمت عملی کے نتیجے میں ہنگامہ خیز مارکیٹوں میں مسلسل نقصانات کا سامنا کرنا پڑ سکتا ہے۔
- مقررہ ٹارگٹ ریٹ اور سٹاپ لاس ریٹ مختلف مارکیٹ کے حالات کے مطابق نہیں ہو سکتے اور انہیں مارکیٹ کے اتار چڑھاؤ کے مطابق ایڈجسٹ کرنے کی ضرورت ہوتی ہے۔
حکمت عملی کی اصلاح کی سمت
- سگنل کی درستگی اور وشوسنییتا کو بہتر بنانے کے لئے مزید تکنیکی اشارے یا مارکیٹ کے جذبات کے اشارے متعارف کروائیں۔
- مارکیٹ میں اتار چڑھاؤ اور اثاثوں کی خصوصیات کے مطابق متحرک طور پر ایڈجسٹ کرنے کے لئے خود کو اپنانے والے ہدف کی شرح منافع اور اسٹاپ نقصان کی شرح کا استعمال کریں۔
- مارکیٹ کے رجحانات اور اتار چڑھاؤ کے دورانیے کے ساتھ مل کر ، مختلف مارکیٹ کے ماحول میں مختلف پیرامیٹرز کی ترتیبات کو اپنانا۔
خلاصہ کریں۔
ای ایم اے کراس سگنل کے ساتھ مل کر آر ایس آئی اور ایم اے سی ڈی کی تصدیق ، اور متحرک اسٹاپ نقصان اور فکسڈ ٹارگٹ ریٹرن کے ساتھ اس حکمت عملی کے خطرے کے انتظام کے طریقہ کار کے ذریعہ ، رجحان ساز مارکیٹوں میں مستحکم منافع حاصل کرنے کا امکان ہے۔ تاہم ، اتار چڑھاؤ والی مارکیٹوں میں ، اس حکمت عملی کو بار بار تجارت اور مسلسل نقصانات کا خطرہ لاحق ہوسکتا ہے۔ لہذا ، حکمت عملی کی موافقت اور استحکام کو بڑھانے کے لئے مزید اصلاحات اور بہتری کی ضرورت ہے۔
- 1