مقداری تجارتی حکمت عملی EMA اور سپر ٹرینڈ کو ملا کر

جائزہ
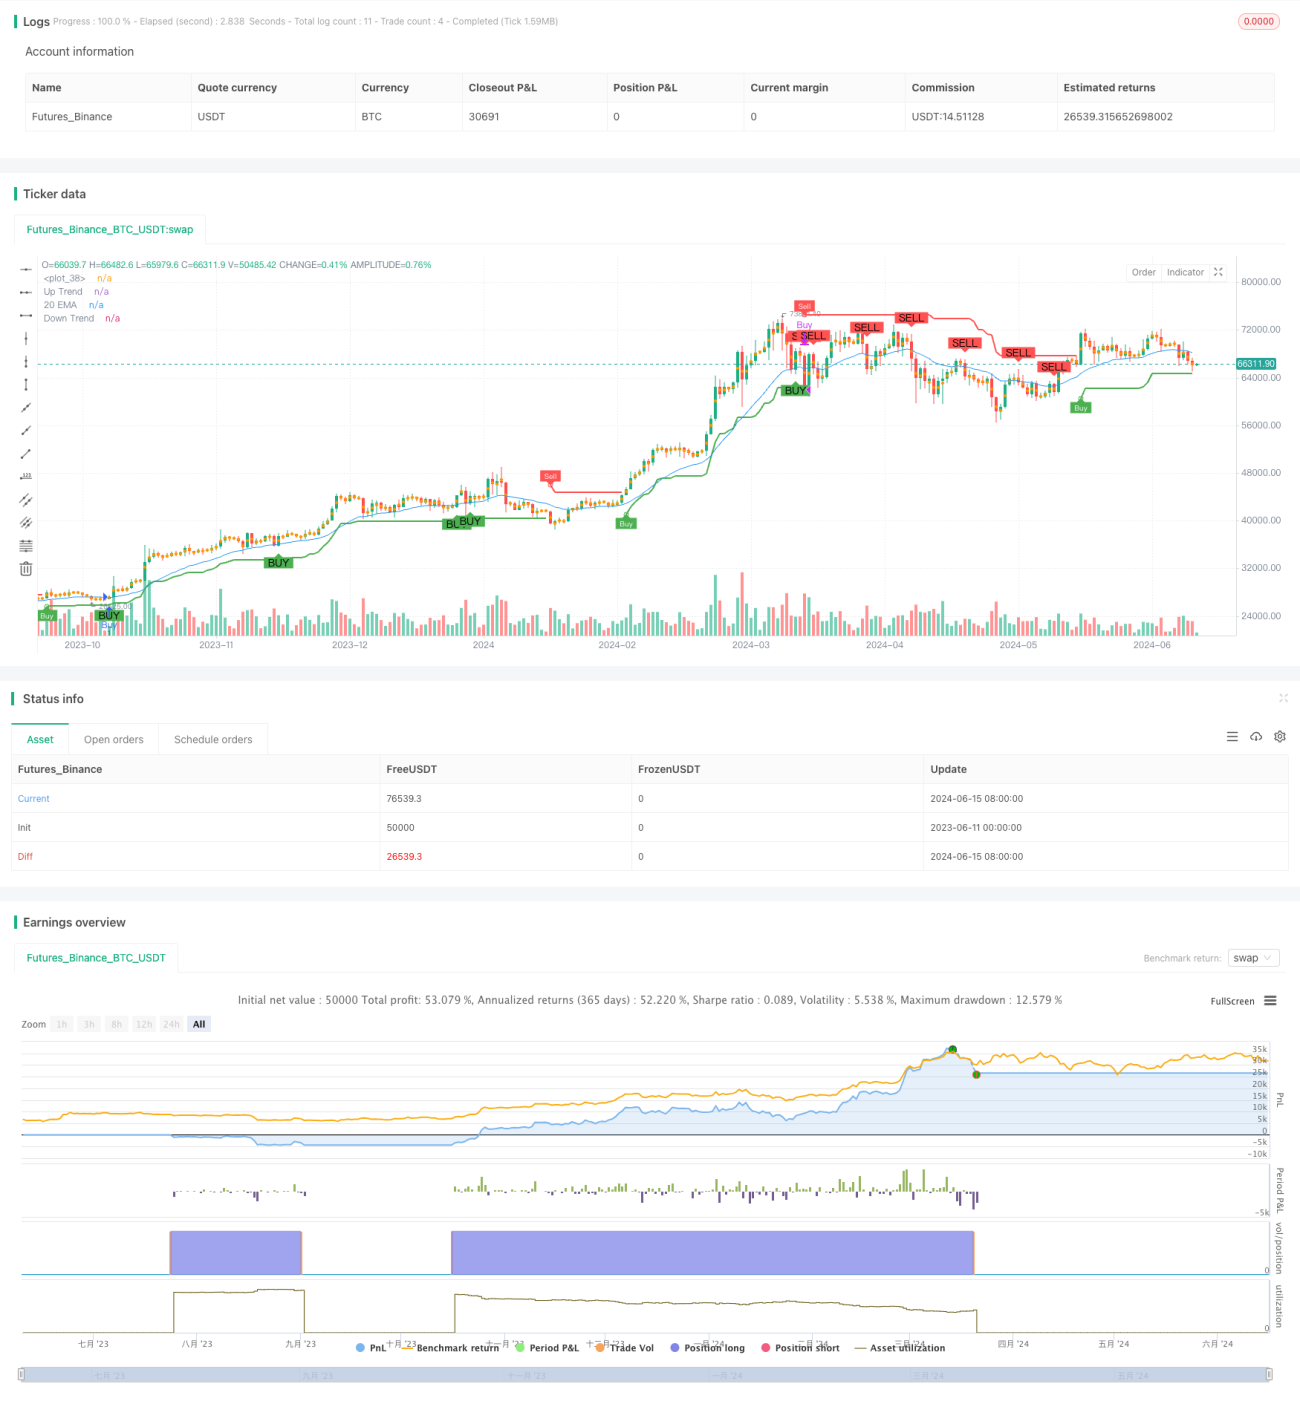
اس حکمت عملی میں انڈیکس کی حرکت پذیر اوسط ((EMA) اور سپر ٹرینڈ اشارے ((Supertrend) کا امتزاج کیا گیا ہے تاکہ خرید و فروخت کے اشارے پیدا کیے جائیں۔ جب قیمت اوپر سے 20 دن کی ای ایم اے کو توڑتی ہے اور سپر ٹرینڈ اشارے بیس رجحان میں ہوتا ہے تو ، خریدنے کا اشارہ پیدا ہوتا ہے۔ جب قیمت نیچے سے 20 دن کی ای ایم اے کو توڑتی ہے اور سپر ٹرینڈ اشارے نیچے کی طرف ہوتا ہے تو ، فروخت کا اشارہ پیدا ہوتا ہے۔ اس حکمت عملی کا مقصد رجحان سازی کی صورتحال کو پکڑنا ہے ، جبکہ غلط سگنل کو کم کرنے کے لئے ای ایم اے کو بطور فلٹرنگ شرط کے طور پر استعمال کرنا ہے۔
حکمت عملی کا اصول
- 20 دن کے ای ایم اے کو رجحان کے فیصلے کے لئے فلٹرنگ کی شرائط کے طور پر شمار کریں۔
- سپر ٹرینڈ انڈیکیٹر کا حساب لگائیں ، جو اوسط حقیقی رینج ((ATR) اور کثیر جہتی رجحانات پر مبنی ہے
- سپر ٹرینڈ اشارے کی رجحان کی سمت اور قیمت کے 20 ویں ای ایم اے کے مقابلے میں پوزیشن پر مبنی خرید و فروخت کے اشارے پیدا کریں:
- جب قیمت اوپر سے 20 دن کی EMA کو توڑ دیتی ہے اور سپر ٹرینڈ اشارے بیس ٹریڈنگ میں ہوتا ہے تو ، خریدنے کا اشارہ ہوتا ہے۔
- جب قیمت 20 دن کے ای ایم اے سے نیچے گرتی ہے اور سپر ٹرینڈ اشارے نیچے کی طرف جاتا ہے تو ، فروخت کا اشارہ پیدا ہوتا ہے۔
- حکمت عملی خریدنے کے اشارے پر زیادہ پوزیشن کھولیں اور فروخت کے اشارے پر کم پوزیشن۔
اسٹریٹجک فوائد
- ای ایم اے اور سپر ٹرینڈ اشارے کے ساتھ مل کر ، یہ رجحان سازی کو مؤثر طریقے سے پکڑ سکتا ہے اور غلط سگنل کو کم کرسکتا ہے۔
- سپر ٹرینڈ اشارے اے ٹی آر پر مبنی ہے ، جو مارکیٹ کی مختلف اتار چڑھاؤ کی شرح کو ایڈجسٹ کرنے کے لئے متحرک طور پر اوپر اور نیچے کے فاصلے کو ایڈجسٹ کرسکتا ہے۔
- EMA رجحانات کے فیصلے کے لئے ایک فلٹرنگ شرط ہے، اس بات کو یقینی بناتا ہے کہ رجحانات کی سمت میں پوزیشن کھولیں اور حکمت عملی کی جیت کی شرح کو بہتر بنائیں.
- حکمت عملی کی منطق سادہ اور واضح ہے، اسے سمجھنا اور اس پر عمل درآمد کرنا آسان ہے۔
اسٹریٹجک رسک
- اس حکمت عملی کے نتیجے میں اکثر خرید و فروخت کے اشارے پیدا ہوسکتے ہیں ، جس کی وجہ سے بہت زیادہ تجارت اور فیسوں کا نقصان ہوتا ہے۔
- حکمت عملی ای ایم اے اور سپر ٹرینڈ اشارے پر انحصار کرتی ہے ، جو مارکیٹ کے بعض حالات میں ناکام یا پیچھے رہ سکتی ہے۔
- اس حکمت عملی میں خطرے کے انتظام کو مدنظر نہیں رکھا گیا ہے ، جیسے کہ اسٹاپ اور پوزیشن مینجمنٹ ، جس کی وجہ سے مارکیٹ میں شدید اتار چڑھاؤ کے دوران بڑے پیمانے پر واپسی ہوسکتی ہے۔
حکمت عملی کی اصلاح کی سمت
- اسٹاپ نقصان کا طریقہ کار شامل کریں ، جیسے کہ اے ٹی آر کے مطابق متحرک اسٹاپ نقصان کو ترتیب دیں ، تاکہ کسی ایک تجارت میں زیادہ سے زیادہ نقصان کو کنٹرول کیا جاسکے۔
- EMA اور سپر ٹرینڈ اشارے کے پیرامیٹرز کو بہتر بنائیں ، جیسے پیرامیٹرز کی اصلاح کا طریقہ استعمال کرکے بہترین پیرامیٹرز کا مجموعہ تلاش کریں ، حکمت عملی کی موافقت اور استحکام کو بہتر بنائیں۔
- پوزیشن مینجمنٹ متعارف کروائیں ، مارکیٹ میں اتار چڑھاؤ یا اکاؤنٹ کے نقصانات کے مطابق پوزیشن کا سائز متحرک طور پر ایڈجسٹ کریں ، تاکہ مجموعی خطرے کو کنٹرول کیا جاسکے۔
- جعلی سگنل کو مزید کم کرنے کے لئے ، دیگر فلٹرنگ شرائط جیسے حجم ، اتار چڑھاؤ ، وغیرہ کو شامل کرنے پر غور کریں۔
خلاصہ کریں۔
اس حکمت عملی کا مقصد رجحان سازی کو پکڑنے کے لئے 20 دن کے ای ایم اے اور سپر ٹرینڈ اشارے کے ساتھ مل کر خرید و فروخت کے اشارے پیدا کرنا ہے۔ حکمت عملی کا فائدہ یہ ہے کہ منطق آسان ہے ، ای ایم اے اور سپر ٹرینڈ اشارے کے ساتھ مل کر جعلی سگنل کو مؤثر طریقے سے کم کیا جاسکتا ہے۔ تاہم ، اتار چڑھاؤ کی منڈیوں میں ، حکمت عملی میں اکثر تجارت کی جاسکتی ہے ، اور خطرے سے متعلق انتظامات کی کمی ہے۔ مستقبل میں حکمت عملی کو بہتر بنانے کے لئے اسٹاپ نقصانات ، پوزیشن مینجمنٹ اور پیرامیٹرز کی اصلاح جیسے طریقوں پر غور کیا جاسکتا ہے۔ مجموعی طور پر ، یہ حکمت عملی رجحان سازی کے لئے ایک آسان اور موثر سوچ پیش کرتی ہے ، لیکن عملی استعمال میں مزید اصلاح اور بہتری کی ضرورت ہے۔
- 1