
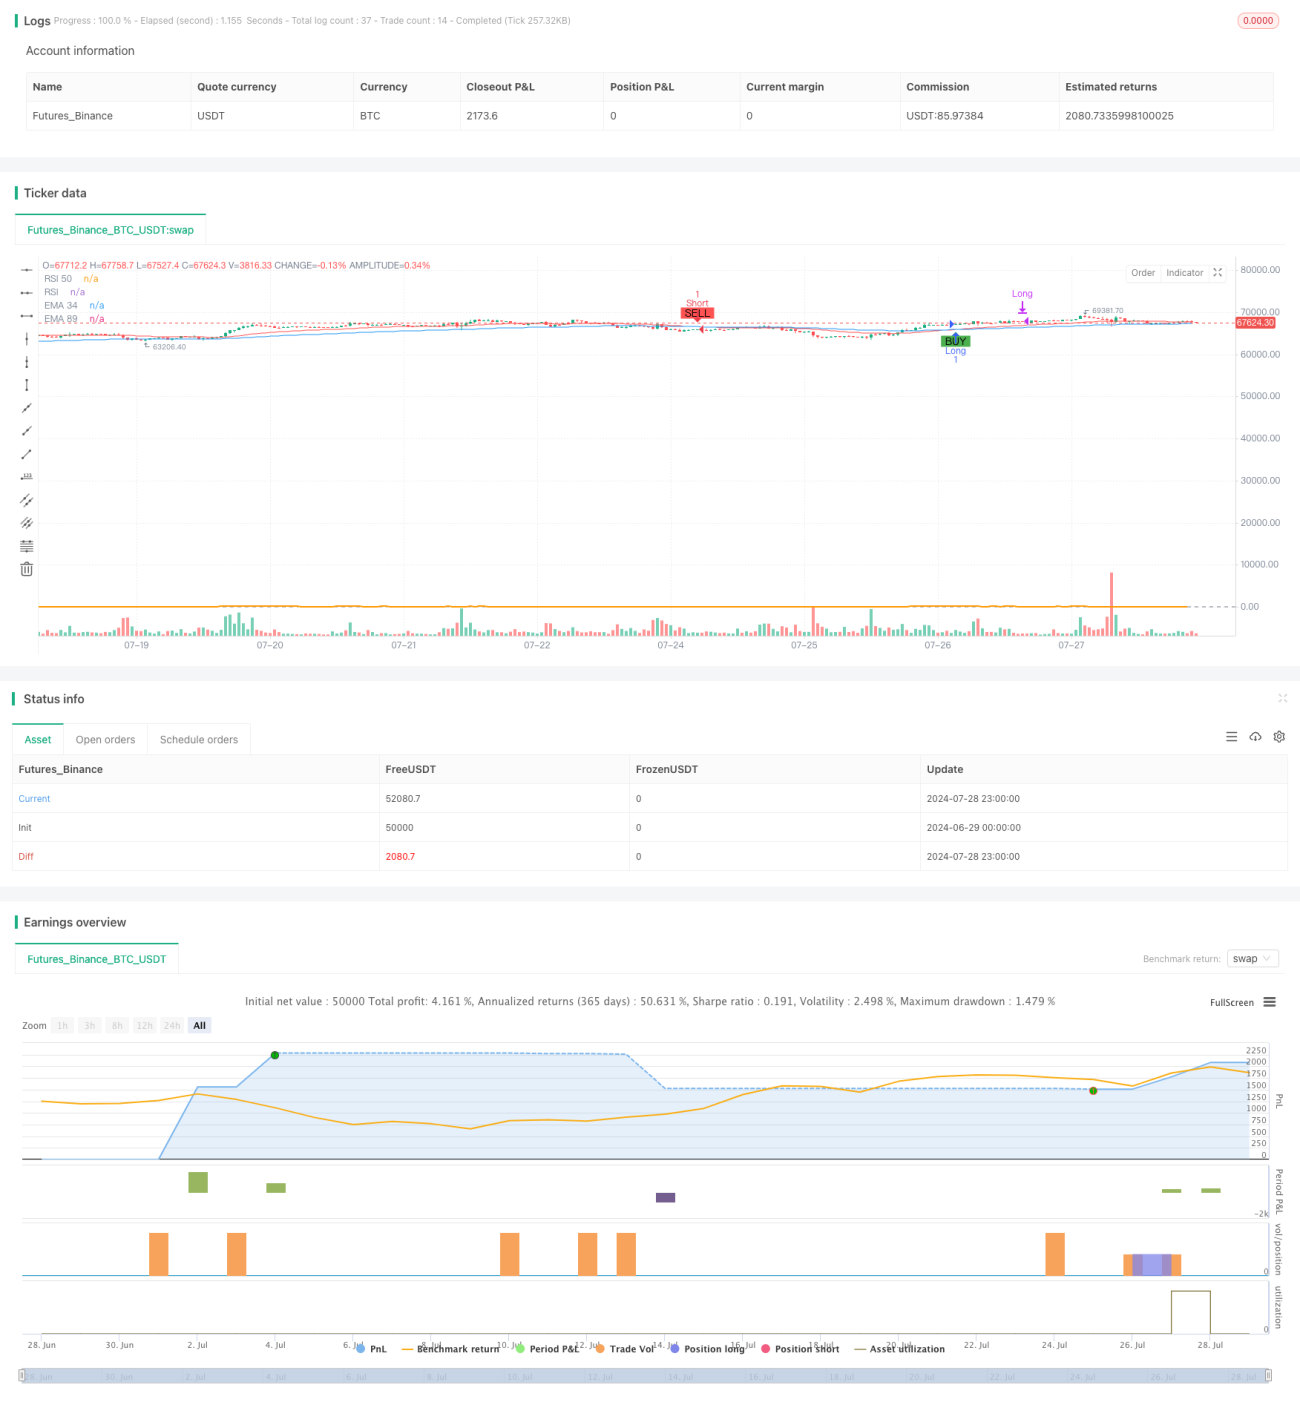
یہ حکمت عملی ایک جامع تجارتی نظام ہے جو متعدد تکنیکی اشارے پر مبنی ہے۔ اس میں ٹریڈنگ سگنل پیدا کرنے اور پوزیشنوں کا انتظام کرنے کے لئے بنیادی طور پر انڈیکس کی حرکت پذیری اوسط ((EMA) ، نسبتا strong مضبوط اشارے ((RSI) اور حجم استعمال کیا جاتا ہے۔ یہ حکمت عملی ای ایم اے کے ذریعے مارکیٹ کے رجحانات کی نشاندہی کرتی ہے ، جبکہ آر ایس آئی اشارے کا استعمال کرتے ہوئے اوورلوڈ اور اوور سیل کا فیصلہ کرتی ہے ، اور تجارتی حجم کے ساتھ مل کر سگنل کی طاقت کی تصدیق کرتی ہے۔ اس کے علاوہ ، اس حکمت عملی میں متحرک اسٹاپ نقصان کا طریقہ کار اور پوزیشن رکھنے کے لئے مقررہ وقت کی حد بھی شامل ہے تاکہ خطرے کو کنٹرول کیا جاسکے اور تجارتی کارکردگی کو بہتر بنایا جاسکے۔
ٹریڈنگ سگنل پیدا:
متحرک سٹاپ نقصان:
فکسڈ پوزیشن ہولڈنگ وقت:
EMA کا نقصان:
ٹرانزیکشن کی تصدیق:
کثیر اشارے کی ہم آہنگی: ای ایم اے ، آر ایس آئی اور تجارت کے حجم کے ساتھ مل کر ، مارکیٹ کی صورتحال کا جامع تجزیہ کریں ، سگنل کی وشوسنییتا کو بہتر بنائیں۔
متحرک رسک مینجمنٹ: مارکیٹ کے اتار چڑھاو کے مطابق ریئل ٹائم میں اسٹاپ اور نقصان کو ایڈجسٹ کریں ، مختلف مارکیٹ کے حالات کے مطابق ڈھالیں۔
فکسڈ پوزیشن ہولڈنگ ٹائم: طویل مدتی پوزیشن کے خطرات سے بچنے اور ہر تجارت کے لئے نمائش کے وقت کو کنٹرول کریں۔
EMA متحرک نقصان: متحرک معاون مزاحمت کے طور پر مساوی لائن کا استعمال کرتے ہوئے ، زیادہ لچکدار نقصان کی حفاظت فراہم کرتا ہے۔
حجم کی تصدیق: سگنل کی مضبوطی کی تصدیق کرنے اور تجارت کی درستگی کو بہتر بنانے کے لئے حجم کی توڑ کا استعمال کریں۔
بصری معاونت: چارٹ پر خرید و فروخت کے سگنل اور اہم قیمت کی سطح کو نشان زد کریں ، تاکہ تجزیہ اور فیصلے میں آسانی ہو۔
زلزلے کی مارکیٹ کا خطرہ: EMA کراسنگ سے اکثر جھوٹے سگنل پیدا ہوسکتے ہیں۔
آر ایس آئی کی مقررہ حد: آر ایس آئی کی مقررہ حد تمام مارکیٹ کے حالات پر لاگو نہیں ہوسکتی ہے۔
ٹرانزیکشن حجم کی کمی کی حساسیت: ٹرانزیکشن حجم کی اوسط سے 3 گنا زیادہ یا کم ہوسکتی ہے ، جس کو مارکیٹ کے مطابق ایڈجسٹ کرنے کی ضرورت ہے۔
فکسڈ پوزیشن ہولڈنگ ٹائم کی حد: 15 روٹ K لائنوں کی فکسڈ پوزیشن کا وقت منافع بخش تجارت کو جلد ختم کرنے کا سبب بن سکتا ہے۔
اسٹاپ اسٹاپ قیمت کی ترتیب: اعلی تجارت کے حجم کے ساتھ اختتامی قیمت اسٹاپ نقصان کی قیمت کے طور پر کافی حد تک بہتر نہیں ہوسکتی ہے۔
متحرک آر ایس آئی کی حد: مارکیٹ میں اتار چڑھاؤ کے مطابق خود بخود آر ایس آئی کی حد کو ایڈجسٹ کرنا۔
تجارت کے حجم میں کمی کو بہتر بنائیں: ایک موافقت کا طریقہ کار متعارف کرایا گیا ہے ، جس میں تاریخی اعداد و شمار کے مطابق تجارت کے حجم کو متحرک طور پر ایڈجسٹ کیا گیا ہے۔
پوزیشن کے وقت کے انتظام کو بہتر بنائیں: رجحان کی طاقت اور منافع بخش صورتحال کے ساتھ مل کر ، زیادہ سے زیادہ پوزیشن کے وقت کو متحرک طور پر ایڈجسٹ کریں۔
اسٹاپ اسٹاپ نقصان کی ترتیب کو بہتر بنائیں: اے ٹی آر اشارے کو متعارف کرانے پر غور کریں ، اسٹاپ اسٹاپ قیمت کو مارکیٹ میں اتار چڑھاؤ کی حرکیات کے مطابق ترتیب دیں۔
رجحان فلٹر شامل کریں: طویل مدتی ای ایم اے یا رجحان اشارے متعارف کروائیں اور اہم رجحانات کے برعکس تجارت سے گریز کریں۔
قیمت کے رویے کا تجزیہ متعارف کروانا: K لائن کی شکل اور معاون مزاحمت کی سطح کے ساتھ مل کر ، داخلے اور باہر نکلنے کی درستگی کو بہتر بنانا۔
واپسی کے کنٹرول کو شامل کرنے پر غور کریں: زیادہ سے زیادہ واپسی کی حد مقرر کریں ، جب مخصوص واپسی کی سطح تک پہنچ جائے تو صف بندی کو مجبور کریں۔
یہ کثیر اشارے جامع متحرک تجارتی حکمت عملی EMA، RSI اور تجارت کی مقدار کو ملا کر ایک جامع تجارتی نظام بناتی ہے۔ یہ نہ صرف مارکیٹ کے رجحانات کو پکڑنے کے قابل ہے بلکہ متحرک اسٹاپ نقصان اور فکسڈ ہولڈنگ ٹائم کے ذریعہ خطرے کا انتظام کرنے کے قابل ہے۔ حکمت عملی کے فوائد اس کے کثیر جہتی تجزیہ اور لچکدار خطرے کے انتظام میں ہیں ، لیکن اس کے ساتھ ساتھ مارکیٹ کے ماحول میں تبدیلیوں سے پیدا ہونے والے چیلنجوں کا بھی سامنا کرنا پڑتا ہے۔ آر ایس آئی کی کمی ، تجارت کی مقدار کے فیصلے کے معیار ، ہولڈنگ ٹائم مینجمنٹ اور اسٹاپ نقصان کی ترتیب کو مزید بہتر بنانے کے ذریعہ ، اس حکمت عملی میں مارکیٹ کے مختلف ماحول میں بہتر کارکردگی کا امکان ہے۔ آخر کار ، یہ حکمت عملی تاجروں کو ایک قابل اعتماد فریم ورک فراہم کرتی ہے جسے انفرادی تجارتی طرز اور مارکیٹ کی خصوصیات کے مطابق تشکیل اور بہتر بنایا جاسکتا ہے۔
/*backtest
start: 2024-06-29 00:00:00
end: 2024-07-29 00:00:00
period: 1h
basePeriod: 15m
exchanges: [{"eid":"Futures_Binance","currency":"BTC_USDT"}]
*/
//@version=5
strategy("EMA & RSI Strategy", overlay=true)
// Install indicators
ema34 = ta.ema(close, 34)
ema89 = ta.ema(close, 89)
ema54 = ta.ema(close, 54)
ema150 = ta.ema(close, 150)
rsi = ta.rsi(close, 14)
// Draw indicator
plot(ema34, color=color.red, title="EMA 34")
plot(ema89, color=color.blue, title="EMA 89")
//plot(ema54, color=color.green, title="EMA 54")
//plot(ema150, color=color.yellow, title="EMA 150")
hline(50, "RSI 50", color=color.gray)
plot(rsi, title="RSI", color=color.orange, linewidth=2, offset=-1)
// condition long or short
longCondition = ta.crossover(ema34, ema89) and rsi > 30
shortCondition = ta.crossunder(ema34, ema89) and rsi < 70
// Add strategy long
if (longCondition)
strategy.entry("Long", strategy.long)
// Add strategy short
if (shortCondition)
strategy.entry("Short", strategy.short)
// Calculate the average volume of previous candles
length = 20 // Number of candles to calculate average volume
avgVolume = ta.sma(volume, length)
highVolumeCondition = volume > 3 * avgVolume
// Determine take profit and stop loss prices when there is high volume
var float takeProfitPriceLong = na
var float stopLossPriceLong = na
var float takeProfitPriceShort = na
var float stopLossPriceShort = na
if (longCondition)
takeProfitPriceLong := na
stopLossPriceLong := na
if (shortCondition)
takeProfitPriceShort := na
stopLossPriceShort := na
// Update take profit and stop loss prices when volume is high
if (strategy.opentrades.entry_id(0) == "Long" and highVolumeCondition)
takeProfitPriceLong := close
stopLossPriceLong := close
if (strategy.opentrades.entry_id(0) == "Short" and highVolumeCondition)
takeProfitPriceShort := close
stopLossPriceShort := close
// Execute exit orders for buy and sell orders when there is high volume
if (not na(takeProfitPriceLong))
strategy.exit("Take Profit Long", from_entry="Long", limit=takeProfitPriceLong, stop=stopLossPriceLong)
if (not na(takeProfitPriceShort))
strategy.exit("Take Profit Short", from_entry="Short", limit=takeProfitPriceShort, stop=stopLossPriceShort)
// Track the number of candles since the order was opened
var int barsSinceEntryLong = na
var int barsSinceEntryShort = na
var bool longPositionClosed = false
var bool shortPositionClosed = false
if (longCondition)
barsSinceEntryLong := 0
longPositionClosed := false
if (shortCondition)
barsSinceEntryShort := 0
shortPositionClosed := false
if (strategy.opentrades.entry_id(0) == "Long")
barsSinceEntryLong := barsSinceEntryLong + 1
if (strategy.opentrades.entry_id(0) == "Short")
barsSinceEntryShort := barsSinceEntryShort + 1
// Check the conditions to close the order at the 15th candle
if (strategy.opentrades.entry_id(0) == "Long" and barsSinceEntryLong >= 15 and not longPositionClosed)
strategy.close("Long")
longPositionClosed := true
if (strategy.opentrades.entry_id(0) == "Short" and barsSinceEntryShort >= 15 and not shortPositionClosed)
strategy.close("Short")
shortPositionClosed := true
// Thêm stop loss theo EMA34
if (strategy.opentrades.entry_id(0) == "Long")
strategy.exit("Stop Loss Long", from_entry="Long", stop=ema34)
if (strategy.opentrades.entry_id(0) == "Short")
strategy.exit("Stop Loss Short", from_entry="Short", stop=ema34)
// Displays buy/sell signals and price levels on the chart
plotshape(series=longCondition, location=location.belowbar, color=color.green, style=shape.labelup, text="BUY")
plotshape(series=shortCondition, location=location.abovebar, color=color.red, style=shape.labeldown, text="SELL")
// Displays take profit and stop loss prices on the chart
// var line takeProfitLineLong = na
// var line stopLossLineLong = na
// var line takeProfitLineShort = na
// var line stopLossLineShort = na
// if (not na(takeProfitPriceLong))
// if na(takeProfitLineLong)
// takeProfitLineLong := line.new(x1=bar_index, y1=takeProfitPriceLong, x2=bar_index + 1, y2=takeProfitPriceLong, color=color.blue, width=1, style=line.style_dashed)
// else
// line.set_xy1(takeProfitLineLong, x=bar_index, y=takeProfitPriceLong)
// line.set_xy2(takeProfitLineLong, x=bar_index + 1, y=takeProfitPriceLong)
// if (not na(stopLossPriceLong))
// if na(stopLossLineLong)
// stopLossLineLong := line.new(x1=bar_index, y1=stopLossPriceLong, x2=bar_index + 1, y2=stopLossPriceLong, color=color.red, width=1, style=line.style_dashed)
// else
// line.set_xy1(stopLossLineLong, x=bar_index, y=stopLossPriceLong)
// line.set_xy2(stopLossLineLong, x=bar_index + 1, y=stopLossPriceLong)
// if (not na(takeProfitPriceShort))
// if na(takeProfitLineShort)
// takeProfitLineShort := line.new(x1=bar_index, y1=takeProfitPriceShort, x2=bar_index + 1, y2=takeProfitPriceShort, color=color.blue, width=1, style=line.style_dashed)
// else
// line.set_xy1(takeProfitLineShort, x=bar_index, y=takeProfitPriceShort)
// line.set_xy2(takeProfitLineShort, x=bar_index + 1, y=takeProfitPriceShort)
// if (not na(stopLossPriceShort))
// if na(stopLossLineShort)
// stopLossLineShort := line.new(x1=bar_index, y1=stopLossPriceShort, x2=bar_index + 1, y2=stopLossPriceShort, color=color.red, width=1, style=line.style_dashed)
// else
// line.set_xy1(stopLossLineShort, x=bar_index, y=stopLossPriceShort)
// line.set_xy2(stopLossLineShort, x=bar_index + 1, y=stopLossPriceShort)
// // Shows annotations for take profit and stop loss prices
// if (not na(takeProfitPriceLong))
// label.new(x=bar_index, y=takeProfitPriceLong, text="TP Long", style=label.style_label_down, color=color.blue, textcolor=color.white)
// if (not na(stopLossPriceLong))
// label.new(x=bar_index, y=stopLossPriceLong, text="SL Long", style=label.style_label_up, color=color.red, textcolor=color.white)
// if (not na(takeProfitPriceShort))
// label.new(x=bar_index, y=takeProfitPriceShort, text="TP Short", style=label.style_label_up, color=color.blue, textcolor=color.white)
// if (not na(stopLossPriceShort))
// label.new(x=bar_index, y=stopLossPriceShort, text="SL Short", style=label.style_label_down, color=color.red, textcolor=color.white)