جائزہ
متحرک پوزیشن مینجمنٹ آر ایس آئی اوور بیئر ریورس حکمت عملی ایک مختصر لائن ٹریڈنگ حکمت عملی ہے جو تکنیکی اشارے اور متحرک پوزیشن مینجمنٹ کو جوڑتی ہے۔ یہ حکمت عملی بنیادی طور پر نسبتا strong مضبوط اشارے ((آر ایس آئی) اور سادہ منتقل اوسط ((ایس ایم اے) کا استعمال کرتی ہے تاکہ ممکنہ اوور بیئر اسٹیٹس اور ریورس مواقع کی نشاندہی کی جاسکے ، اور بیچوں میں پوزیشن بنانے کے طریقہ سے رسک ریٹرن کو بہتر بنایا جاسکے۔ اس حکمت عملی کا بنیادی خیال یہ ہے کہ جب اثاثوں کی قیمتیں طویل عرصے تک نیچے کی طرف بڑھتی ہیں اور مختصر مدت میں اوور بیئر ہوتی ہے تو اس کی جگہ خالی ہوجاتی ہے ، اور جب مارکیٹ میں اوور سیل یا رجحان میں تبدیلی کا اشارہ ہوتا ہے تو اس کی پوزیشن کو کم کردیا جاتا ہے۔
حکمت عملی کا اصول
اس حکمت عملی کے کام کرنے کے اصول میں درج ذیل چند اہم اقدامات شامل ہیں:
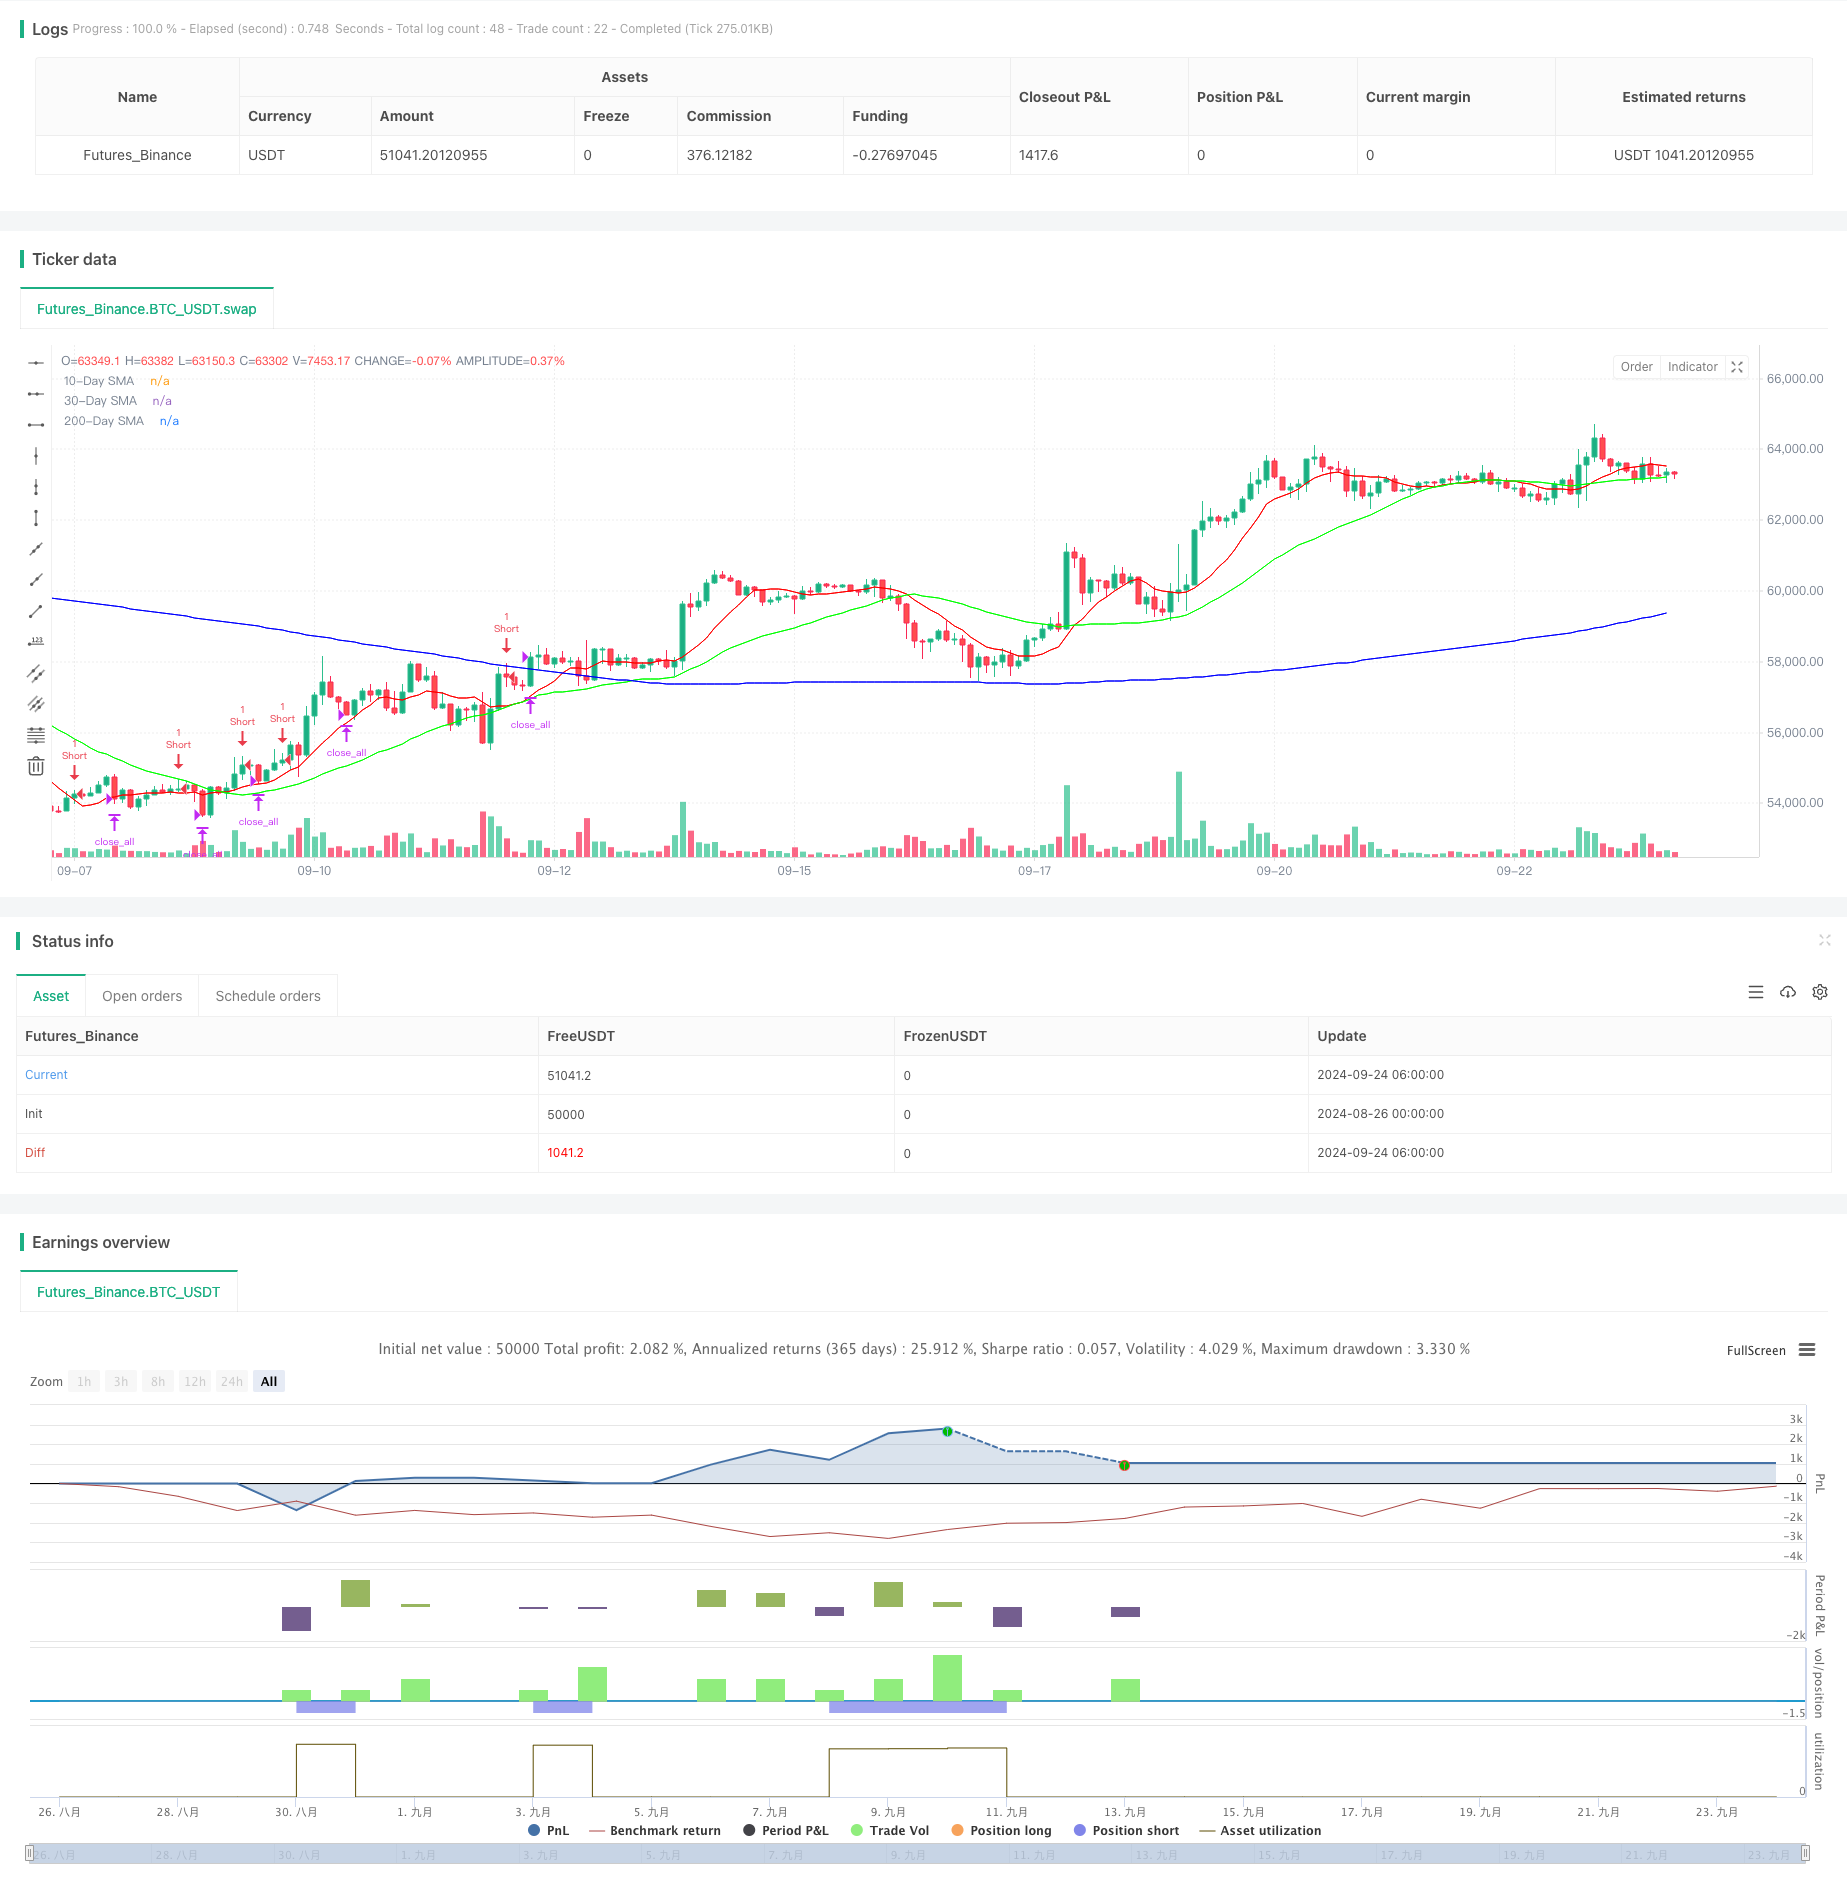
- طویل مدتی رجحانات کا تعین: 200 دن کی سادہ حرکت پذیری اوسط ((SMA) کا استعمال طویل مدتی رجحانات کے فلٹر کے طور پر کریں۔ حکمت عملی صرف اس صورت میں نظر آتی ہے جب قیمت 200 دن کے SMA سے کم ہو۔
- اوور بائڈ اسٹیٹس کی شناخت: قلیل مدتی اوور بائڈ اسٹیٹس کا اندازہ لگانے کے لئے دو دن کے لئے لگاتار 75 سے اوپر 2 سائیکل RSI کا استعمال کریں۔
- بیچ کی تعمیر: ابتدائی طور پر 10٪ پوزیشن پر پوزیشن قائم کی گئی ، اس کے بعد قیمت کی نقل و حرکت کے مطابق آہستہ آہستہ پوزیشن بڑھائی گئی۔ جب قیمت پچھلی پوزیشن کی قیمت سے زیادہ ہو تو ، 20٪ ، 30٪ اور 40٪ پوزیشن میں اضافہ کیا گیا ہے۔
- باہر نکلنے کی شرائط: جب 2 سائیکل RSI 30 سے کم ہو (جس کا مطلب یہ ہے کہ اس سے زیادہ فروخت ہونے کا امکان ہے) یا 10 دن کے SMA پر 30 دن کے SMA کو عبور کرنا (جس کا مطلب یہ ہے کہ رجحان میں تبدیلی آسکتی ہے) ، تمام پوزیشنوں کو ختم کردیں۔
اسٹریٹجک فوائد
- خطرے پر قابو پانا: ایک ہی تجارت کے خطرے کو مؤثر طریقے سے کنٹرول کرنے کے لئے بیچوں میں اسٹاک اور متحرک پوزیشن مینجمنٹ کے ذریعہ۔
- رجحانات کا سراغ لگانا: طویل مدتی رجحانات کو پکڑنے کے ساتھ ساتھ قلیل مدتی تبدیلی کے مواقع کی نشاندہی کرنے کے لئے طویل مدتی چلتی اوسط کا ایک مجموعہ استعمال کرنا۔
- لچکدار: حکمت عملی کے پیرامیٹرز کو مختلف مارکیٹ کے حالات اور تجارت کی اقسام کے مطابق ایڈجسٹ کیا جاسکتا ہے ، اور یہ بہت زیادہ موافقت پذیر ہے۔
- خودکار عملدرآمد: حکمت عملی کی منطق واضح ہے ، اور خود کار طریقے سے تجارت کرنے کے لئے پروگرام کرنا آسان ہے۔
اسٹریٹجک رسک
- مارکیٹ کا خطرہ: ایک مضبوط عروج کے ساتھ ، مسلسل نقصان کا خطرہ ہوسکتا ہے۔
- زیادہ ذخیرہ اندوزی کا خطرہ: ذخیرہ اندوزی کے بیچوں کا نظام مارکیٹ میں غلط سگنل کے تحت زیادہ نمائش کا سبب بن سکتا ہے۔
- لیکویڈیٹی کا خطرہ: کم لیکویڈیٹی والے بازاروں میں ، بڑے پیمانے پر لین دین کے نتیجے میں پوائنٹس میں اضافہ ہوسکتا ہے۔
- تکنیکی اشارے کی حدود: آر ایس آئی اور ایس ایم اے جیسے تکنیکی اشارے غلط سگنل پیدا کرسکتے ہیں ، جس سے غلط تجارتی فیصلے ہوتے ہیں۔
حکمت عملی کی اصلاح کی سمت
- اتار چڑھاؤ کے اشارے متعارف کروائیں: اے ٹی آر ((اوسط حقیقی طول و عرض) جیسے اتار چڑھاؤ کے اشارے کے ساتھ مل کر ، پوزیشنوں کی تعمیر اور پوزیشنوں کی قیمتوں کو متحرک طور پر ایڈجسٹ کریں۔
- زیادہ سے زیادہ پوزیشننگ منطق: مارکیٹ میں اتار چڑھاؤ کی سطح کے مطابق متحرک طور پر پوزیشننگ تناسب کو ایڈجسٹ کرنے پر غور کیا جاسکتا ہے ، تاکہ اعلی اتار چڑھاؤ کے دوران ضرورت سے زیادہ پوزیشننگ سے بچا جاسکے۔
- بنیادی فلٹرنگ میں اضافہ: بنیادی عوامل جیسے مارکیٹ کے جذبات کے اشارے یا میکرو اقتصادی اعداد و شمار کے ساتھ مل کر ، داخلے کے اشارے کی وشوسنییتا میں اضافہ کریں۔
- واپسی کی اصلاح: بہت سارے تاریخی اعداد و شمار کی واپسی کے ذریعے ، مختلف پیرامیٹرز کی ترتیبات کو بہتر بنانا ، حکمت عملی کی استحکام اور منافع کو بہتر بنانا۔
خلاصہ کریں۔
متحرک پوزیشن مینجمنٹ آر ایس آئی اووربائڈ ریورس اسٹریٹجی ایک مختصر لائن ٹریڈنگ حکمت عملی ہے جو تکنیکی تجزیہ اور رسک مینجمنٹ کو یکجا کرتی ہے۔ آر ایس آئی اووربائڈ سگنل اور ایس ایم اے رجحانات کا اندازہ لگانے کے ذریعہ ، اس حکمت عملی کا مقصد مارکیٹ میں ممکنہ ریورس مواقع کو پکڑنا ہے۔ اس کے بیچوں میں پوزیشن بنانے اور متحرک باہر نکلنے کے طریقہ کار سے منافع کے تناسب کو بہتر بنانے میں مدد ملتی ہے۔ تاہم ، اس حکمت عملی کو استعمال کرتے وقت ، سرمایہ کاروں کو مارکیٹ کے خطرات اور تکنیکی اشارے کی حدود پر دھیان دینے کی ضرورت ہے ، اور عملی تجارتی ماحول کے مطابق اسٹریٹجک پیرامیٹرز اور منطق کو مستقل طور پر بہتر بنانا چاہئے۔
/*backtest
start: 2024-08-26 00:00:00
end: 2024-09-24 08:00:00
period: 2h
basePeriod: 2h
exchanges: [{"eid":"Futures_Binance","currency":"BTC_USDT"}]
*/

//@version=5
strategy("TPS Short Strategy by Larry Conners", overlay=true)

// Define parameters as inputs
sma_length_200 = input.int(200, title="200-Day SMA Length")
rsi_length_2 = input.int(2, title="2-Period RSI Length")
sma_length_10 = input.int(10, title="10-Day SMA Length")
sma_length_30 = input.int(30, title="30-Day SMA Length")

// Define colors as RGB values
color_sma_200 = input.color(color.rgb(0, 0, 255), title="200-Day SMA Color") // Blue
color_sma_10 = input.color(color.rgb(255, 0, 0), title="10-Day SMA Color") // Red
color_sma_30 = input.color(color.rgb(0, 255, 0), title="30-Day SMA Color") // Green

// Calculate indicators
sma_200 = ta.sma(close, sma_length_200)
rsi_2 = ta.rsi(close, rsi_length_2)
sma_10 = ta.sma(close, sma_length_10)
sma_30 = ta.sma(close, sma_length_30)

// Define conditions
below_sma_200 = close < sma_200
rsi_2_above_75_two_days = rsi_2[1] > 75 and rsi_2 > 75
price_higher_than_entry = na(strategy.opentrades.entry_price(0)) ? false : close > strategy.opentrades.entry_price(0)

// Entry conditions
if (below_sma_200 and rsi_2_above_75_two_days and na(strategy.opentrades.entry_price(0)))
    strategy.entry("Short", strategy.short, qty=1) // Short 10% of the position

// Scaling in conditions
if (price_higher_than_entry)
    strategy.entry("Short2", strategy.short, qty=2) // Short 20% more of the position

if (price_higher_than_entry)
    strategy.entry("Short3", strategy.short, qty=3) // Short 30% more of the position

if (price_higher_than_entry)
    strategy.entry("Short4", strategy.short, qty=4) // Short 40% more of the position

// Exit conditions
exit_condition_rsi_below_30 = rsi_2 < 30
exit_condition_sma_cross = ta.crossover(sma_10, sma_30)

if (exit_condition_rsi_below_30 or exit_condition_sma_cross)
    strategy.close_all() // Close all positions

// Plot indicators
plot(sma_200, color=color_sma_200, title="200-Day SMA")
plot(sma_10, color=color_sma_10, title="10-Day SMA")
plot(sma_30, color=color_sma_30, title="30-Day SMA")