
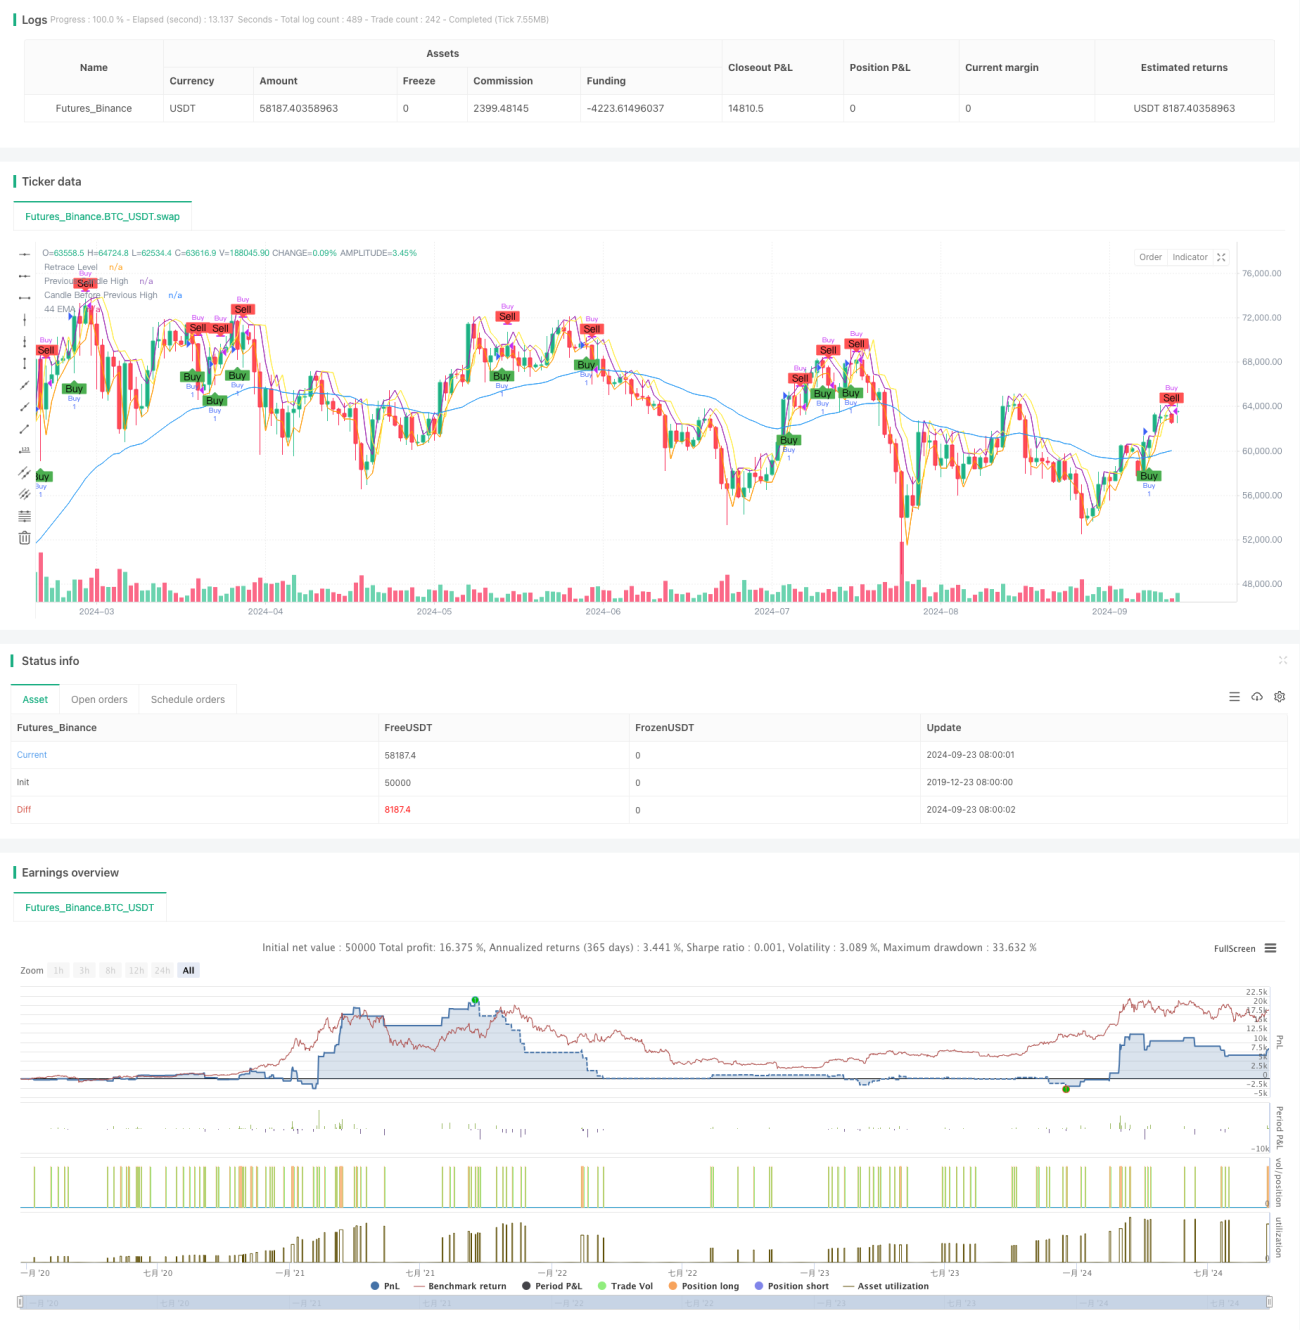
جائزہ
یہ ایک رجحان سے باخبر رہنے کی حکمت عملی ہے جو 44 ادوار کی انڈیکس کی حرکت پذیری اوسط ((EMA) پر مبنی ہے۔ یہ حکمت عملی بنیادی طور پر بڑھتے ہوئے رجحان میں خریدنے کے مواقع کی تلاش کرتی ہے ، جس میں EMA کی جھلک ، چارٹ کی شکل اور قیمت کی واپسی جیسے متعدد شرائط کا تجزیہ کرکے داخلے کا وقت طے کیا جاتا ہے۔ حکمت عملی کا ڈیزائن 2 منٹ اور 5 منٹ جیسے مختصر وقت کی مدت کے لئے ہے ، جس کا مقصد مختصر مدت کی قیمتوں میں اتار چڑھاؤ میں تجارتی مواقع کو پکڑنا ہے۔
حکمت عملی کا اصول
- 44 سائیکل ای ایم اے اور اس کی جھکاؤ کا حساب لگائیں تاکہ یہ معلوم کیا جاسکے کہ آیا رجحان کافی حد تک جھکا ہوا ہے۔
- پچھلے جوڑے کی شکل کا تجزیہ کریں ، اس کی ضرورت ہے کہ یہ سورج کی کرن ہو اور EMA سے زیادہ قیمت پر بند ہو۔
- دیکھیں کہ کیا موجودہ کدو پچھلے کدو کی 50 فیصد پوزیشن پر واپس آ گیا ہے۔
- اس بات کو یقینی بنانا کہ پچھلے پتھر کی اختتامی قیمت پچھلے پتھر کی اعلی ترین قیمت سے زیادہ ہے ، تاکہ یہ یقینی بنایا جاسکے کہ بڑھتے ہوئے رجحان کا تسلسل ہے۔
- جب تمام شرائط پوری ہوجائیں تو ، موجودہ کرنسی کی واپسی کی پوزیشن پر زیادہ پوزیشن لگائیں۔
- باہر نکلنے کی شرائط یہ ہیں: پچھلا نچلا نچلا یا موجودہ نچلے درجے سے پہلے ایک نچلے درجے سے نیچے۔
اسٹریٹجک فوائد
- ایک سے زیادہ فلٹرنگ: EMA ، چارٹ کی شکل اور قیمت کی واپسی جیسے متعدد اشارے کے ساتھ مل کر ، جعلی سگنل کو مؤثر طریقے سے کم کریں۔
- رجحانات کی پیروی: ای ایم اے کے اسکیلپنگ فیصلے کے ذریعہ واضح اوپر کی طرف رجحانات میں تجارت کو یقینی بنانا ، جیت کی شرح کو بہتر بنانا۔
- واپسی میں داخلہ: قیمتوں میں واپسی کو بطور داخلہ نقطہ استعمال کریں ، خریداری کی قیمتوں کو بہتر بنائیں ، اور ممکنہ طور پر منافع کی گنجائش میں اضافہ کریں۔
- لچکدار: مختلف ٹائم فریموں پر لاگو کیا جاسکتا ہے ، جو مختصر لائن اور دن کے تاجروں کے لئے موزوں ہے۔
- خطرے پر قابو پانا: واضح اسٹاپ نقصان کی شرائط ہیں جو ہر تجارت کے خطرے کو کنٹرول کرنے میں مدد کرتی ہیں۔
اسٹریٹجک رسک
- تاخیر: EMA ایک تاخیر کا اشارے کے طور پر ، شدید اتار چڑھاؤ کے حالات میں ردعمل میں تاخیر کا شکار ہوسکتا ہے۔
- جعلی بریک: افقی ڈسک مرتب کرنے والے علاقے میں اکثر جعلی بریک سگنل پیدا ہوسکتے ہیں۔
- ضرورت سے زیادہ ٹریڈنگ: ہائی اتار چڑھاؤ والے بازاروں میں ضرورت سے زیادہ ٹریڈنگ کا سبب بن سکتی ہے ، جس سے ٹرانزیکشن کی لاگت میں اضافہ ہوتا ہے۔
- رجحان کا الٹ جانا: تیزی سے رجحان کا الٹ جانا بڑے نقصان کا سبب بن سکتا ہے۔
- پیرامیٹر حساسیت: حکمت عملی کا اثر EMA دورانیہ جیسے پیرامیٹرز کی ترتیبات کے لئے زیادہ حساس ہے۔
حکمت عملی کی اصلاح کی سمت
- اضافی فلٹرز متعارف کروائیں: جیسے RSI یا MACD ، رجحان کی طاقت اور سمت کی مزید تصدیق کریں۔
- متحرک اسٹاپ: مارکیٹ میں اتار چڑھاو کے لئے بہتر طور پر ایڈجسٹ کرنے کے لئے اے ٹی آر اشارے کا استعمال کرتے ہوئے متحرک اسٹاپ سیٹ کریں۔
- ٹریفک کا تجزیہ بڑھانا: ٹریفک کے اشارے کو جوڑ کر ، داخلی سگنل کی وشوسنییتا میں اضافہ کریں۔
- EMA سائیکل کو بہتر بنائیں: مختلف EMA سائیکلوں کی جانچ پڑتال کرکے بہترین پیرامیٹرز کا مجموعہ تلاش کریں۔
- رجحان کی طاقت کے اشارے شامل کریں: جیسے ADX ، صرف مضبوط رجحانات میں داخل ہونے کو یقینی بنائیں۔
- بہتر آؤٹ پٹ میکانزم: ٹریلنگ اسٹاپ کی طرح بہتر منافع بخش حکمت عملی تیار کریں۔
خلاصہ کریں۔
گوس کراس ای ایم اے ٹرینڈ سلائڈ پوائنٹ ٹریکنگ اسٹریٹجی ایک ٹرینڈ ٹریکنگ سسٹم ہے جس میں متعدد تکنیکی اشارے شامل ہیں۔ ای ایم اے ، چارٹ پیٹرن تجزیہ اور قیمتوں میں واپسی جیسے کثیر جہتی فیصلوں کے ذریعہ ، اس حکمت عملی میں بڑھتے ہوئے رجحانات کی نشاندہی کرنے اور داخلے کے وقت کو بہتر بنانے کے لئے اچھی صلاحیت ظاہر کی گئی ہے۔ تاہم ، صارفین کو ضرورت سے زیادہ تجارت کے خطرے پر قابو پانے اور مارکیٹ کے مختلف حالات کے لئے پیرامیٹرز کو بہتر بنانے پر توجہ دینے کی ضرورت ہے۔ اضافی تکنیکی اشارے متعارف کرانے اور خطرے کے انتظام کے طریقہ کار کو بہتر بنانے کے ذریعہ ، اس حکمت عملی کو قلیل مدتی تجارت میں زیادہ مستحکم کارکردگی کی توقع ہے۔
- 1