متعدد تکنیکی اشاریوں پر مبنی حکمت عملی کے بعد تبدیلی کا رجحان

جائزہ
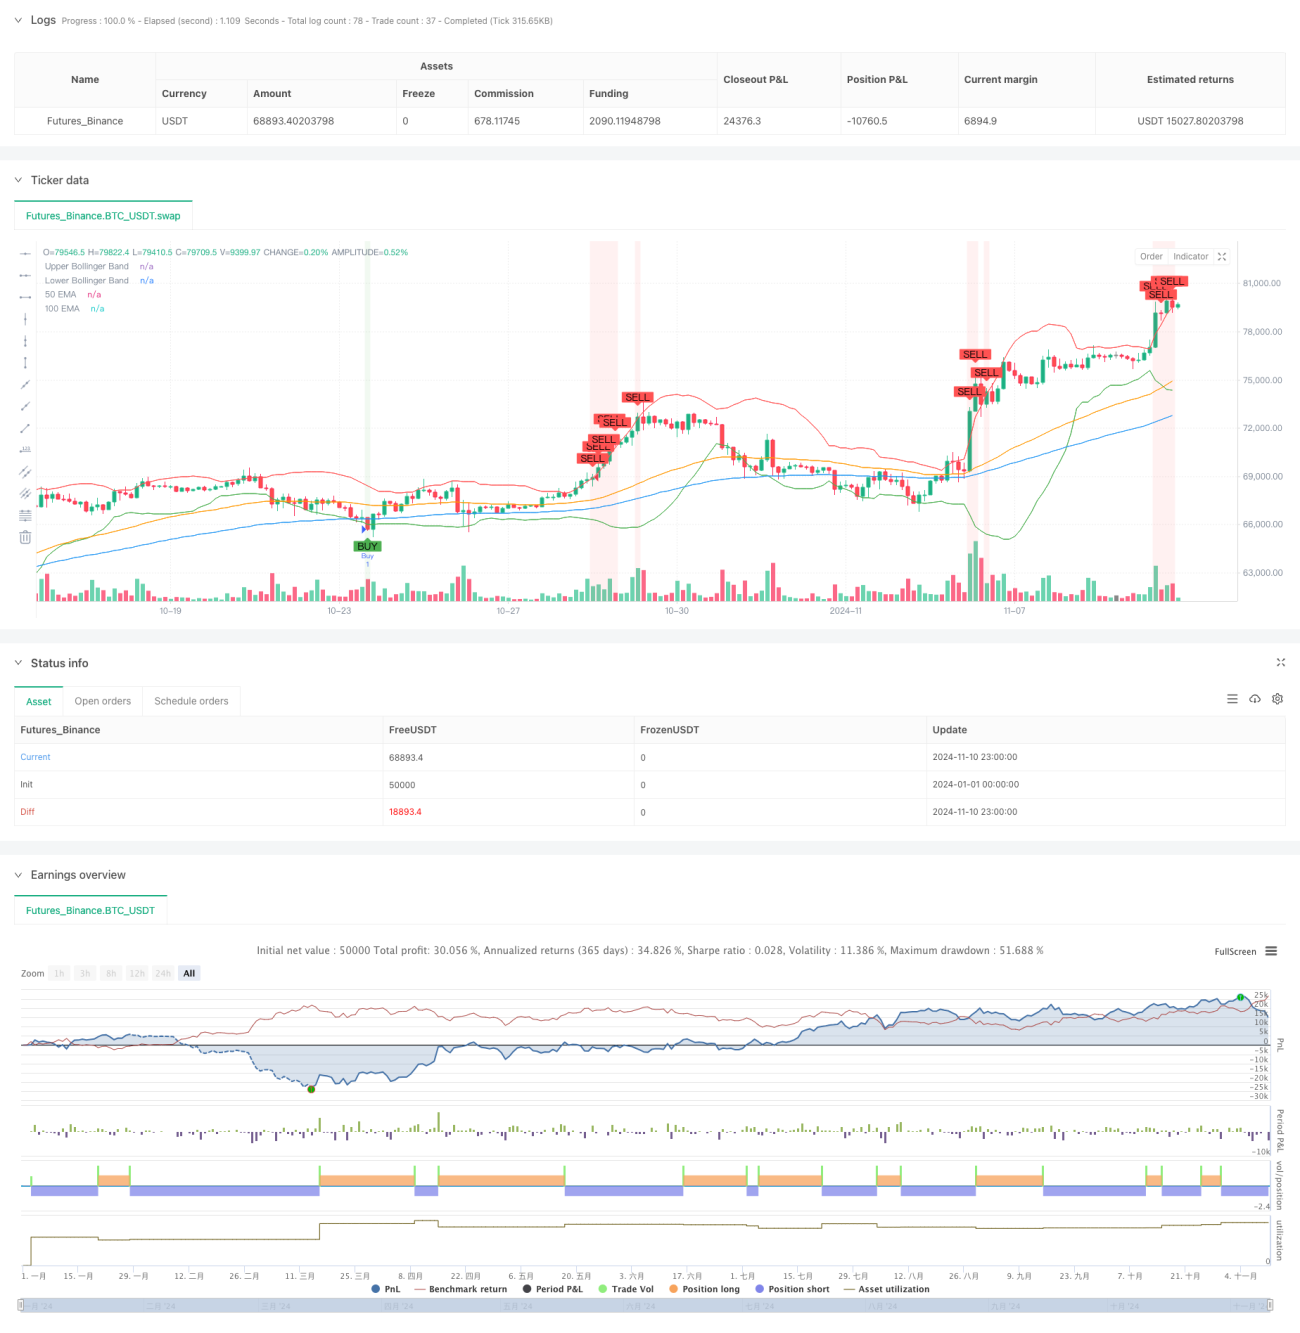
یہ حکمت عملی ایک ہائبرڈ حکمت عملی کا نظام ہے جس میں اوسط واپسی اور رجحانات کی پیروی شامل ہے ، بنیادی طور پر آر ایس آئی ، بلین بینڈ اور متعدد ای ایم اے اشارے کے ساتھ مل کر مارکیٹ میں اوورلوپ اور اوور سیل مواقع کو پکڑنے کے لئے۔ حکمت عملی روایتی تکنیکی تجزیہ اشارے پر مبنی ہے ، جس میں رجحانات کی تصدیق اور رینج کے جھٹکے کے فیصلے میں اضافہ کیا گیا ہے ، جس سے حکمت عملی کی درستگی میں اضافہ ہوا ہے۔
حکمت عملی کا اصول
حکمت عملی ٹریڈنگ سگنل کی تصدیق کے لئے ٹرپل توثیق کا طریقہ کار استعمال کرتی ہے۔ سب سے پہلے ، RSI اشارے کے ذریعہ اوورلوڈ اوور سیل علاقوں کی نشاندہی کی جاتی ہے ، جب RSI 30 سے کم یا 70 سے زیادہ ہوتا ہے تو ابتدائی سگنل کو متحرک کیا جاتا ہے۔ اس کے بعد ، بلین بینڈ ((BB) کو قیمت کے اتار چڑھاؤ کی حد کے طور پر استعمال کیا جاتا ہے ، جب قیمت ٹریک اپ یا نیچے ٹریک ہوجاتی ہے تو مزید سگنل کی تصدیق کی جاتی ہے۔ آخر میں ، 100/50 دن ای ایم اے کی نسبت کی پوزیشن اور اتار چڑھاؤ کے ذریعہ مارکیٹ کے رجحانات کا فیصلہ کیا جاتا ہے۔ تجارت صرف اس وقت کی جاتی ہے جب رجحان کی سمت پہلے دو سگنل سے مطابقت رکھتی ہو۔ حکمت عملی میں ای ایم اے کی اتار چڑھاؤ کی شرح کا فیصلہ بھی شامل کیا جاتا ہے ، جس میں پوری مارکیٹ کی شناخت کی جاتی ہے۔
اسٹریٹجک فوائد
- متعدد تکنیکی اشارے کی کراس تصدیق ، جعلی سگنل کو نمایاں طور پر کم کریں
- ہائپر خرید اور ہائپر فروخت اور رجحانات کی نگرانی کے ساتھ حکمت عملی کی موافقت میں اضافہ
- اوسط لہر کے اتار چڑھاؤ کا تعین متعارف کرانے ، اور بازار کی صفائی کو مؤثر طریقے سے شناخت کرنا
- حکمت عملی کی نگرانی اور اصلاح کے لئے واضح بصری اثرات
- مارکیٹ کے مختلف حالات کے مطابق ایڈجسٹ کرنے کے لئے پیرامیٹرز
اسٹریٹجک رسک
- ایک سے زیادہ اشارے سگنل وقفہ کا سبب بن سکتے ہیں۔
- شدید اتار چڑھاؤ والے بازاروں میں تجارت کے مواقع سے محروم رہنا
- ضرورت سے زیادہ پیرامیٹر کی اصلاح اوور فٹنگ کا باعث بن سکتی ہے۔
- ای ایم اے کے رجحانات کے فیصلے سے افقی منڈیوں میں الجھن کا اشارہ ہوسکتا ہے
یہ مشورہ دیا جاتا ہے کہ حکمت عملی کی استحکام کو مختلف وقت کے دورانیے کے اعداد و شمار کی جانچ پڑتال کے ذریعے تصدیق کی جائے اور مناسب اسٹاپ نقصان کو ترتیب دیا جائے تاکہ خطرے کو کنٹرول کیا جاسکے۔
حکمت عملی کی اصلاح کی سمت
- ٹرانزیکشن انڈیکس کو بطور معاون توثیق شامل کرنا
- خود کار طریقے سے پیرامیٹرز کو ایڈجسٹ کرنے کا طریقہ کار متعارف کرایا
- اسٹاپ اسٹاپ نقصان کے انتظام کے ماڈیول کو شامل کریں
- رجحان کی طاقت کا درجہ بندی کا نظام تیار کرنا
- EMA اتار چڑھاو کی شرح کے حساب کے لئے موزوں طریقہ
- مارکیٹ میں اتار چڑھاؤ کے فلٹر شامل کریں
خلاصہ کریں۔
اس حکمت عملی میں متعدد تکنیکی اشارے کے ہم آہنگی کے ذریعے حکمت عملی کی لچک کو مدنظر رکھا گیا ہے ، جبکہ استحکام کو یقینی بنایا گیا ہے۔ حکمت عملی کی منطق واضح ہے ، اس کا نفاذ آسان ہے ، اور اس کی عملی قدر بہتر ہے۔ معقول پیرامیٹرز کی اصلاح اور خطرے کے انتظام کے ذریعہ ، حکمت عملی مختلف مارکیٹ کے ماحول میں مستحکم کارکردگی کو برقرار رکھنے کی امید رکھتی ہے۔
- 1