بولنگر بینڈز اور آر ایس آئی کو ملانے والی انکولی ٹرینڈ ٹریڈنگ حکمت عملی

جائزہ
یہ حکمت عملی ایک رجحان ٹریکنگ سسٹم ہے جس میں متعدد تکنیکی اشارے شامل ہیں ، اور تین کلاسیکی اشارے ، برن بینڈ ، آر ایس آئی اور ایم اے سی ڈی کے ساتھ مل کر کام کرتے ہیں ، تاکہ مارکیٹ میں اتار چڑھاؤ اور رجحان کی تبدیلی کے دوران تجارتی مواقع پر قبضہ کیا جاسکے۔ یہ حکمت عملی ایک پرامڈائزنگ پوزیشننگ کا استعمال کرتی ہے ، جس میں سخت تجارتی وقفہ کنٹرول کے ذریعہ خطرے کا انتظام کیا جاتا ہے۔
حکمت عملی کا اصول
حکمت عملی کی بنیادی منطق تین سگنل کی تصدیق پر مبنی ہے:
- RSI اشارے کا استعمال کرتے ہوئے اوورلوڈ اور اوورلوڈ علاقوں کی نشاندہی کریں ، جہاں RSI < 45 کو اوورلوڈ اور RSI > 55 کو اوورلوڈ سمجھا جاتا ہے
- قیمت کی پوزیشن کا تعین کرنے کے لئے برین بینڈ چینل کا استعمال کرتے ہوئے ، جب قیمت قریب آتی ہے یا برین بینڈ کو توڑ کر نیچے کی طرف جاتی ہے تو سگنل پیدا ہوتا ہے
- رجحان کی تصدیق کے طور پر MACD گولڈ فورک ڈیڈ فورکس کا استعمال کرتے ہوئے ، آر ایس آئی اور برن بینڈ سگنل کے ساتھ گونج کے بعد پوزیشن کھولیں
اس حکمت عملی میں کم سے کم تجارتی وقفہ (15 سائیکل) بھی شامل ہے ، جس سے زیادہ تجارت سے بچا جاسکتا ہے ، اور اسی وقت پائریڈ ہولڈنگ مینجمنٹ کا استعمال کیا جاسکتا ہے۔
اسٹریٹجک فوائد
- متعدد تکنیکی اشارے کی کراس تصدیق ، جعلی سگنلوں میں نمایاں کمی
- پیراڈائزڈ ریزرو میکانزم فنڈز کے استعمال میں بہتری لاتا ہے
- کم سے کم ٹرانزیکشن وقفے کو ترتیب دیں تاکہ ٹرانزیکشن کی فریکوئنسی کو مؤثر طریقے سے کنٹرول کیا جاسکے
- اشارے کے پیرامیٹرز کو ایڈجسٹ کیا جاسکتا ہے اور اس میں اعلی موافقت ہے
- خطرے کے دروازے کو کنٹرول کرنے کے لئے خود کار طریقے سے صفائی کا طریقہ کار
اسٹریٹجک رسک
- ایک سے زیادہ اشارے سگنل وقفہ کا سبب بن سکتے ہیں۔
- ہلچل مچانے والی مارکیٹ میں بار بار تجارت کا امکان
- پیراڈائزڈ پوزیشننگ رجحان کی تبدیلی کے بعد بڑے نقصان کا سبب بن سکتی ہے
- RSI کی مقررہ حد تمام مارکیٹ کے حالات کے لیے موزوں نہیں ہو سکتی
حکمت عملی کی اصلاح کی سمت
- مارکیٹ میں اتار چڑھاو کے مطابق متحرک طور پر ایڈجسٹ کرنے کے لئے ایڈجسٹ آر ایس آئی ٹرن آؤٹ متعارف کرایا
- معاون تصدیق کے طور پر حجم اشارے شامل کریں۔
- پوزیشن مینجمنٹ الگورتھم کو بہتر بنانا
- زیادہ لچکدار سٹاپ نقصان کے نظام میں شامل ہونا
- مارکیٹ کی سائیکل کی خصوصیات کو مدنظر رکھتے ہوئے ، تجارت کے وقفے کو متحرک طور پر ایڈجسٹ کریں
خلاصہ کریں۔
یہ حکمت عملی متعدد تکنیکی اشارے کے ہم آہنگی سے کام کرتی ہے ، خطرے پر قابو پانے کے ساتھ ساتھ مستحکم منافع کی تلاش کرتی ہے۔ اگرچہ کچھ پسماندگی موجود ہے ، لیکن معقول پیرامیٹرز کی اصلاح اور رسک مینجمنٹ میکانزم کے ذریعہ ، حکمت عملی نے بہتر موافقت اور استحکام کا مظاہرہ کیا ہے۔ مستقبل میں ، اسٹریٹجی کی کارکردگی کو مزید بہتر بنانے کے لئے خودکشی کے میکانزم اور بہتر پوزیشن مینجمنٹ متعارف کرانے کے قابل ہوسکتا ہے۔
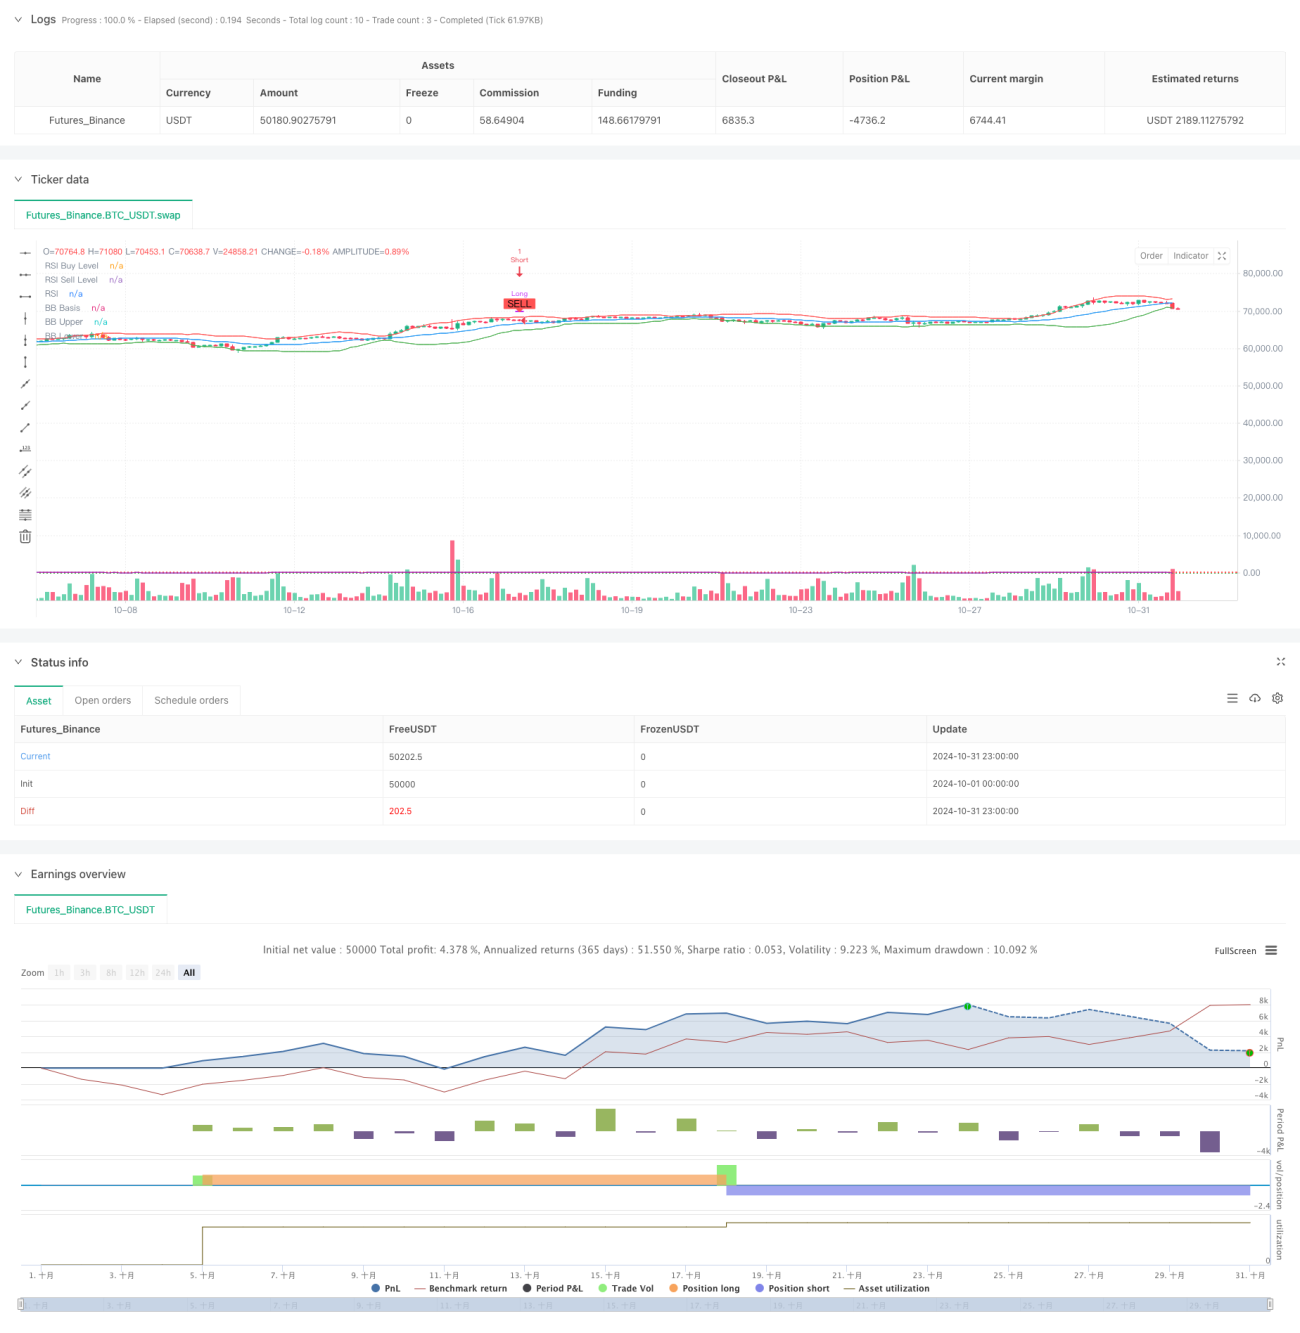
/*backtest
start: 2024-10-01 00:00:00
end: 2024-10-31 23:59:59
period: 3h
basePeriod: 3h
exchanges: [{"eid":"Futures_Binance","currency":"BTC_USDT"}]
*/

//@version=5
strategy("[ETH] Optimized Trend Strategy", shorttitle="Lorenzo-SuperScalping", overlay=true, pyramiding=3, initial_capital=100000, currency=currency.USD)

// === Input Parameters === //- 1