
خلاصہ
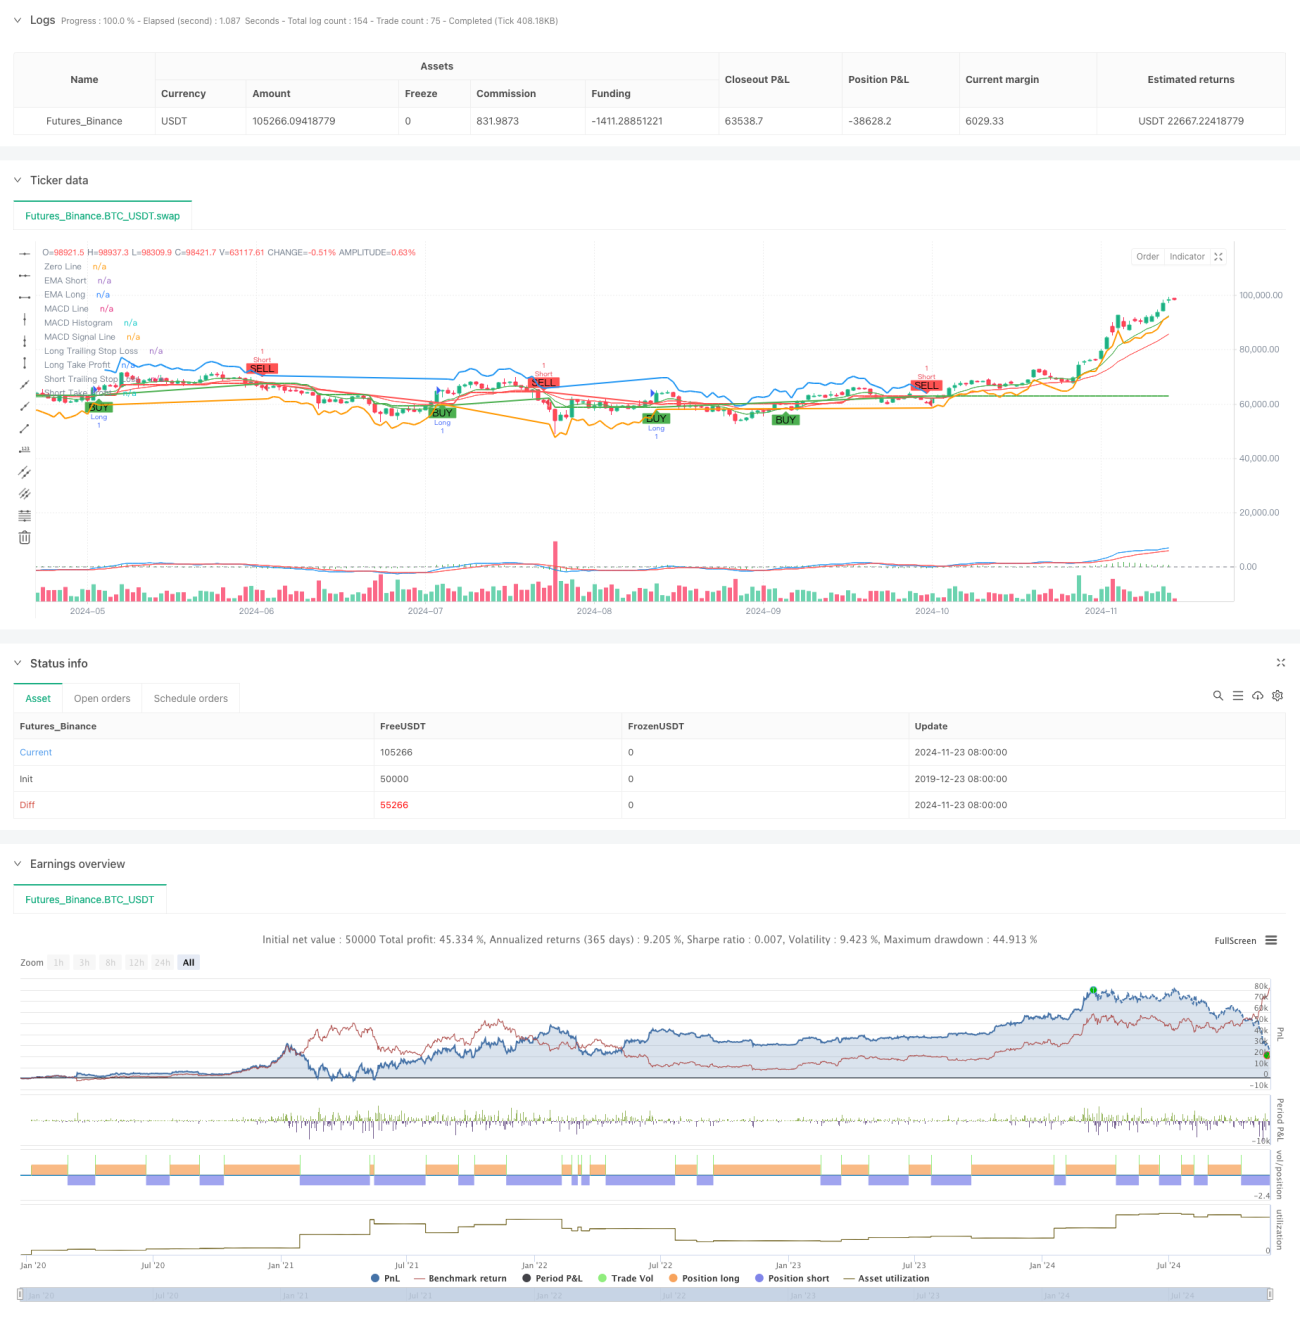
یہ حکمت عملی ایک جامع ٹرینڈ فالوونگ ٹریڈنگ سسٹم ہے، جس میں کثیر وقتی فریم تجزیہ، اوسط حرکت (EMA) کا نظام، مومینٹم انڈیکیٹر اور وولیٹیلیٹی انڈیکیٹر شامل ہیں۔ یہ سسٹم مختصر اور طویل مدتی ایکسپوننشیل موونگ ایوریج (EMA) کے کراس کے ذریعے رجحان کی سمت کی شناخت کرتا ہے، رشتہ دار طاقت انڈیکیٹر (RSI) سے ضرورت سے زیادہ خریدی/فروخت کی صورت حال کا اندازہ لگاتا ہے، MACD سے مومینٹم کی تصدیق کرتا ہے، اور اعلیٰ وقتی فریم کے EMA کو رجحان فلٹر کے طور پر استعمال کرتا ہے۔ یہ سسٹم ATR پر مبنی متحرک اسٹاپ لاس اور منافع لینے کا طریقہ استعمال کرتا ہے، جو مارکیٹ کی وولیٹیلیٹی کے مطابق خود بخود ایڈجسٹ ہو سکتا ہے۔
حکمت عملی کا اصول
یہ حکمت عملی فیصلہ سازی کے لیے کثیر پرتوں والے توثیقی طریقہ کار کو استعمال کرتی ہے:
- رجحان شناخت کی پرت: 9 اور 21 پیریڈ کے EMA کے کراس کے ذریعے رجحان میں تبدیلی کو پکڑنا
- مومینٹم تصدیق کی پرت: MACD انڈیکیٹر (12,26,9) کے کراس اور سمت کے ذریعے رجحانی مومینٹم کی تصدیق
- زیادہ خریدی/فروخت کی فلٹرنگ: RSI (14) انڈیکیٹر کو 70/30 کی سطحوں پر فلٹر کے طور پر استعمال کرنا
- اعلیٰ وقتی فریم کی تصدیق: اختیاری طور پر ڈیلی چارٹ کے EMA کو رجحان فلٹر کے طور پر استعمال کرنا
- رسک مینجمنٹ کی پرت: 1.5 گنا ATR کو ٹریلنگ اسٹاپ کے طور پر اور 2 گنا ATR کو منافع کے ہدف کے طور پر استعمال کرنا
یہ سسٹم صرف اس وقت پوزیشن کھولتا ہے جب متعدد شرائط پوری ہوں: EMA کراس، RSI انتہائی قدر پر نہ ہو، MACD کی سمت درست ہو اور اعلیٰ وقتی فریم رجحان کی تصدیق کرے۔ اخراج کے لیے ٹریلنگ اسٹاپ اور مقررہ منافع کے ہدف کا امتزاج استعمال کیا جاتا ہے۔
حکمت عملی کے فوائد
- کثیر توثیقی طریقہ کار جھوٹے سگنلز کو نمایاں طور پر کم کرتا ہے
- اعلیٰ وقتی فریم کا رجحانی فلٹر جیتنے کی شرح کو بڑھاتا ہے
- وولیٹیلیٹی پر مبنی متحرک اسٹاپ لاس زیادہ موافقت فراہم کرتا ہے
- مکمل رسک مینجمنٹ سسٹم
- پیرامیٹرز کو مختلف مارکیٹ خصوصیات کے مطابق لچکدار طریقے سے ایڈجسٹ کیا جا سکتا ہے
- دو طرفہ ٹریڈنگ کو سپورٹ کرتا ہے، مختلف مارکیٹ ماحول کے مطابق ڈھل سکتا ہے
- انڈیکیٹرز کا امتزاج رجحان اور مومینٹم دونوں کا خیال رکھتا ہے
حکمت عملی کے خطرات
- متعدد شرائط کی وجہ سے کچھ ٹریڈنگ مواقع چھوٹ سکتے ہیں
- سائیڈ ویز مارکیٹ میں بار بار ٹریڈنگ ہو سکتی ہے
- پیرامیٹر کی بہتری اوور فٹنگ کا باعث بن سکتی ہے
- اعلیٰ وقتی فریم کی تصدیق کی وجہ سے داخلے میں تاخیر ہو سکتی ہے
حل:
- مختلف مارکیٹ خصوصیات کے مطابق پیرامیٹرز کو متحرک طور پر ایڈجسٹ کریں
- ٹریڈنگ سمت کے انتخاب میں لچک بڑھائیں
- وولیٹیلیٹی فلٹرنگ میکانزم متعارف کروائیں
- پیرامیٹرز کے خودکار موافقت کے طریقہ کار کو بہتر بنائیں
حکمت عملی کی بہتری کی سمتیں
- وولیٹیلیٹی فلٹرنگ میکانزم متعارف کروانا، زیادہ وولیٹیلیٹی کے دوران پوزیشن کے حجم کو ایڈجسٹ کرنا
- پیرامیٹرز کا خودکار موافقت کا طریقہ کار تیار کرنا، مارکیٹ کی حالت کے مطابق متحرک ایڈجسٹمنٹ
- حجم کے انڈیکیٹرز کو شامل کرکے سگنلز کی تاثیر کی تصدیق کرنا
- اعلیٰ وقتی فریم کے رجحان کے فیصلے کی منطق کو بہتر بنانا
- اسٹاپ لاس کے طریقوں کو مکمل کرنا، وقت پر مبنی اسٹاپ لاس پر غور کرنا
- حکمت عملی کی کارکردگی کا جائزہ لینے والا ماڈیول تیار کرنا
خلاصہ
یہ حکمت عملی ایک مکمل ٹرینڈ فالوونگ ٹریڈنگ سسٹم ہے، جو متعدد تکنیکی انڈیکیٹرز کے امتزاج اور سخت رسک مینجمنٹ کے ذریعے رجحانی مارکیٹ میں مستحکم منافع کما سکتی ہے۔ یہ سسٹم توسیع پذیر ہے اور بہتری کے ذریعے مختلف مارکیٹ ماحول کے مطابق ڈھالا جا سکتا ہے۔ تجویز ہے کہ لائیو ٹریڈنگ سے پہلے کافی بیک ٹیسٹنگ اور پیرامیٹر آپٹیمائزیشن کی جائے۔
- 1