
جائزہ
یہ حکمت عملی ایک مقداری تجارتی نظام ہے جس میں بولنگر بینڈ ، نسبتا strong مضبوط اشارے (RSI) اور متحرک لاگت اوسط (DCA) شامل ہیں۔ حکمت عملی فنڈ مینجمنٹ کے قواعد طے کرکے ، مارکیٹ میں اتار چڑھاؤ کے دوران خود بخود بیچ میں پوزیشن بنانے کی کارروائی کرتی ہے ، جبکہ تکنیکی اشارے کے ساتھ مل کر خرید و فروخت کے سگنل کا فیصلہ کرتی ہے ، جس سے خطرہ قابو میں آتا ہے۔ اس نظام میں اسٹاپ لاجسٹک اور مجموعی منافع کی ٹریکنگ کی خصوصیات بھی شامل ہیں ، جس سے تجارت کی کارکردگی کو مؤثر طریقے سے نگرانی اور انتظام کیا جاسکتا ہے۔
حکمت عملی کا اصول
حکمت عملی بنیادی طور پر درج ذیل بنیادی اجزاء پر مبنی ہے:
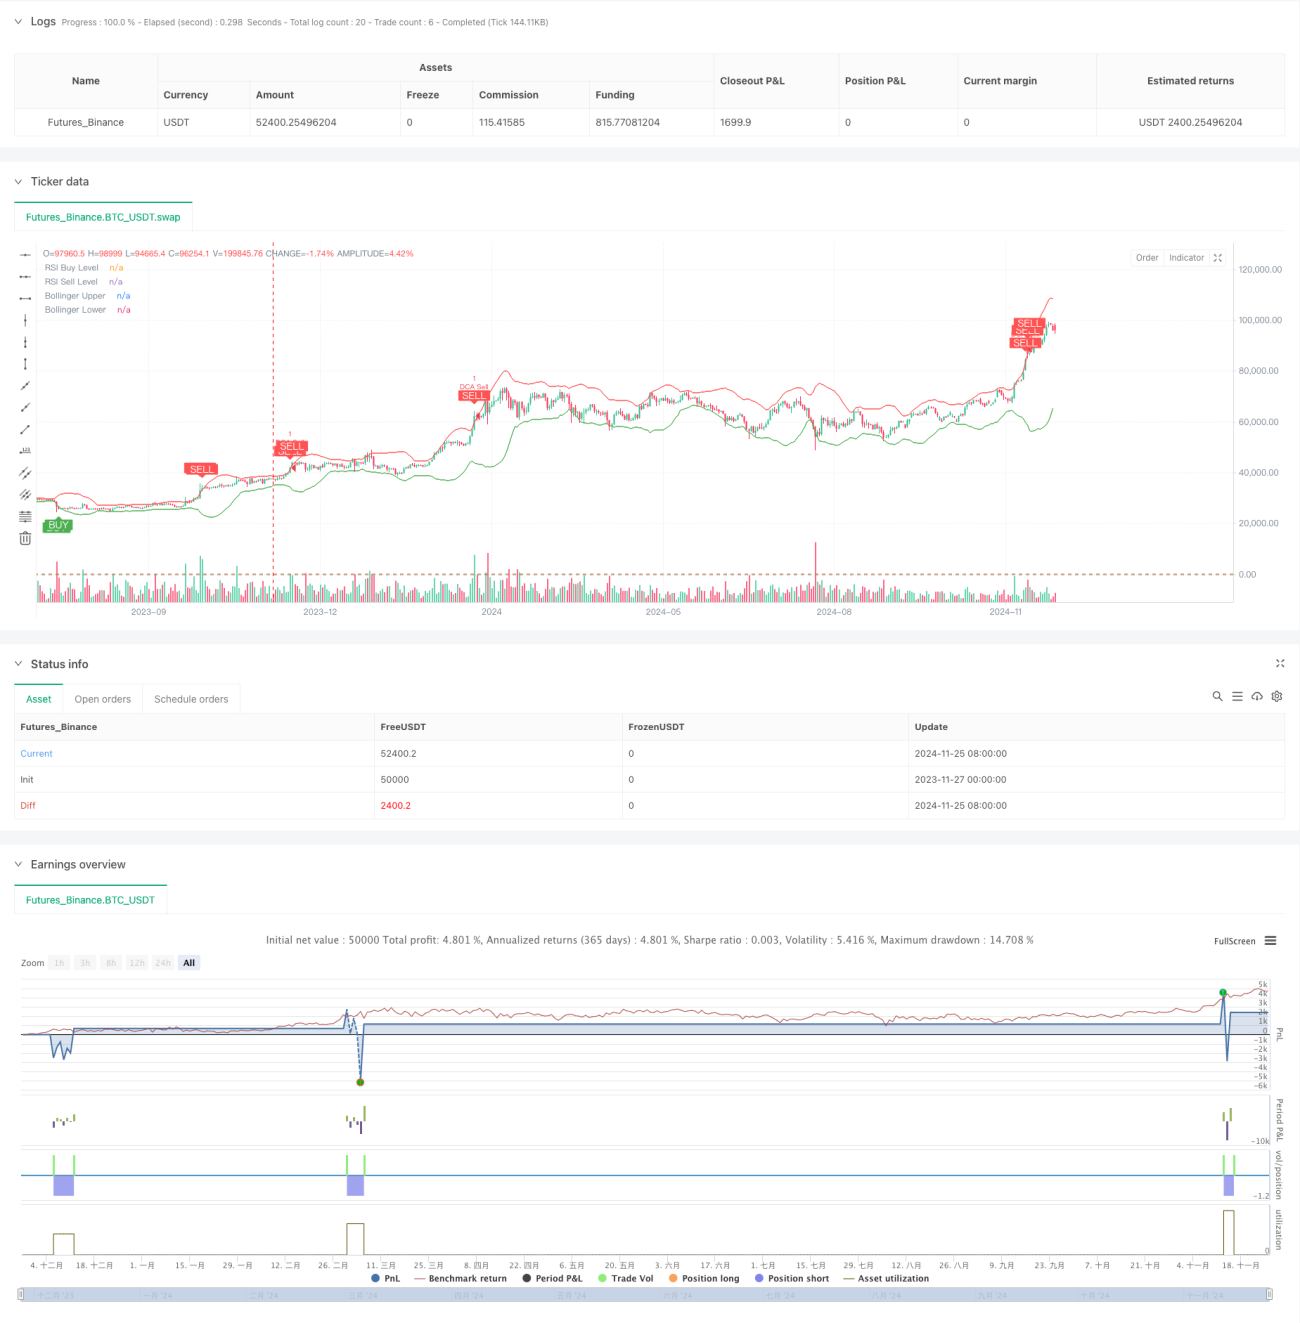
- برن بینڈ اشارے کا استعمال قیمتوں میں اتار چڑھاو کی حد کا تعین کرنے کے لئے کیا جاتا ہے ، جب قیمت نیچے کی ٹریک کو چھوتی ہے تو خریدنے پر غور کریں اور جب اوپر کی ٹریک کو چھوتی ہے تو فروخت پر غور کریں
- آر ایس آئی اشارے کا استعمال مارکیٹ میں اوور بیو اور اوور سیل کی حیثیت کی تصدیق کے لئے کیا جاتا ہے ، آر ایس آئی 25 سے کم ہونے پر اوور سیل کی تصدیق کرتا ہے ، 75 سے زیادہ ہونے پر اوور سیل کی تصدیق کرتا ہے
- ڈی سی اے ماڈیول اکاؤنٹس کے حقوق اور مفادات کی حرکیات کے مطابق ہر پوزیشن کی رقم کا حساب لگاتا ہے ، تاکہ فنڈز کا خود بخود انتظام کیا جاسکے
- اسٹاپ اسٹاپ ماڈیول 5٪ منافع کا ہدف طے کرتا ہے ، اور ہدف تک پہنچ جاتا ہے خود کار طریقے سے بیعانہ کی حفاظت
- مارکیٹ کی حالت کی نگرانی ماڈیول 90 دن کی مارکیٹ میں تبدیلی کی شدت کا حساب لگاتا ہے تاکہ مجموعی رجحانات کا اندازہ لگایا جاسکے
- مجموعی منافع ٹریکنگ ماڈیول حکمت عملی کی کارکردگی کا اندازہ کرنے کے لئے ہر تجارت کے منافع اور نقصان کو ریکارڈ کرتا ہے
اسٹریٹجک فوائد
- متعدد تکنیکی اشارے کی کراس تصدیق کے ساتھ ، سگنل کی وشوسنییتا میں اضافہ
- متحرک پوزیشن مینجمنٹ کا استعمال کرتے ہوئے ، فکسڈ پوزیشنوں کے خطرات سے بچیں
- معقول رکاوٹ کی شرائط مرتب کریں اور منافع کو بروقت لاک کریں۔
- مارکیٹ کے رجحانات کی نگرانی کے ساتھ، آپ کو بڑے پیمانے پر سمجھنے میں مدد ملتی ہے
- حکمت عملی کی کارکردگی کا تجزیہ کرنے کے لئے منافع ٹریکنگ کا ایک مکمل نظام
- ٹریڈنگ کے مواقع کے لئے ریئل ٹائم انتباہات کے لئے تیار کردہ انتباہات
اسٹریٹجک رسک
- مارکیٹ میں ہلچل اکثر ٹریڈنگ کے اخراجات میں اضافے کا سبب بن سکتی ہے
- RSI اشارے رجحان مارکیٹ میں پیچھے رہ سکتے ہیں
- فکسڈ فی صد اسٹاپ مارکیٹ میں تیزی سے تیزی سے تیزی سے تیزی سے تیزی سے تیزی سے تیزی سے تیزی سے تیزی سے تیزی سے تیزی سے تیزی سے تیزی سے تیزی سے بڑھتی ہوئی ہے.
- ڈی سی اے کی حکمت عملی کے نتیجے میں مارکیٹ میں یکطرفہ کمی کے نتیجے میں بڑے پیمانے پر واپسی کا امکان ہے
خطرات کو منظم کرنے کے لیے درج ذیل اقدامات کی سفارش کی جاتی ہے:
- زیادہ سے زیادہ پوزیشن کی حد مقرر کریں
- مارکیٹ کے اتار چڑھاو کی طرف سے متحرک ایڈجسٹمنٹ پیرامیٹرز
- ٹرینڈ فلٹر شامل کریں۔
- درجہ بندی کی روک تھام کی حکمت عملی کو لاگو کرنا
حکمت عملی کی اصلاح کی سمت
- پیرامیٹرز کی متحرک اصلاح:
- برن بینڈ پیرامیٹرز کو اتار چڑھاؤ کی شرح کے مطابق ایڈجسٹ کیا جاسکتا ہے
- RSI کی حد مارکیٹ کے دورانیے کے ساتھ تبدیل ہوتی ہے
- ڈی سی اے فنڈز کا تناسب اکاؤنٹ کے سائز کے ساتھ ایڈجسٹ کیا جا سکتا ہے
- سگنلنگ سسٹم میں اضافہ:
- حجم کی تصدیق میں اضافہ کریں۔
- ٹرینڈ لائن تجزیہ شامل کریں
- مزید تکنیکی اشارے کے ساتھ کراس ویلیڈنگ
- خطرے پر قابو پانا:
- متحرک سٹاپ نقصان
- زیادہ سے زیادہ واپسی کنٹرول شامل کریں
- روزانہ نقصان کی حد مقرر
خلاصہ کریں۔
اس حکمت عملی نے تکنیکی تجزیہ اور فنڈ مینجمنٹ کے طریقوں کو مربوط طور پر استعمال کرکے ایک نسبتا complete مکمل تجارتی نظام تشکیل دیا ہے۔ اس حکمت عملی کے فوائد کثیر سگنل کی شناخت اور بہتر خطرے کے انتظام میں ہیں ، لیکن پھر بھی اس کو عملی طور پر اچھی طرح سے جانچنے اور بہتر بنانے کی ضرورت ہے۔ پیرامیٹرز کی ترتیبات کو مستقل طور پر بہتر بنانے اور معاون اشارے میں اضافے کے ذریعہ ، اس حکمت عملی کو حقیقی تجارت میں مستحکم کارکردگی کا مظاہرہ کرنے کی امید ہے۔
/*backtest
start: 2023-11-27 00:00:00
end: 2024-11-26 00:00:00
period: 1d
basePeriod: 1d
exchanges: [{"eid":"Futures_Binance","currency":"BTC_USDT"}]
*/

//@version=5
strategy("Combined BB RSI with Cumulative Profit, Market Change, and Futures Strategy (DCA)", shorttitle="BB RSI Combined DCA Strategy", overlay=true)

// Input Parameters- 1