ملٹی پیریڈ ٹرینڈ ٹریکنگ اور ATR اتار چڑھاؤ کے انتظام کی حکمت عملی

جائزہ
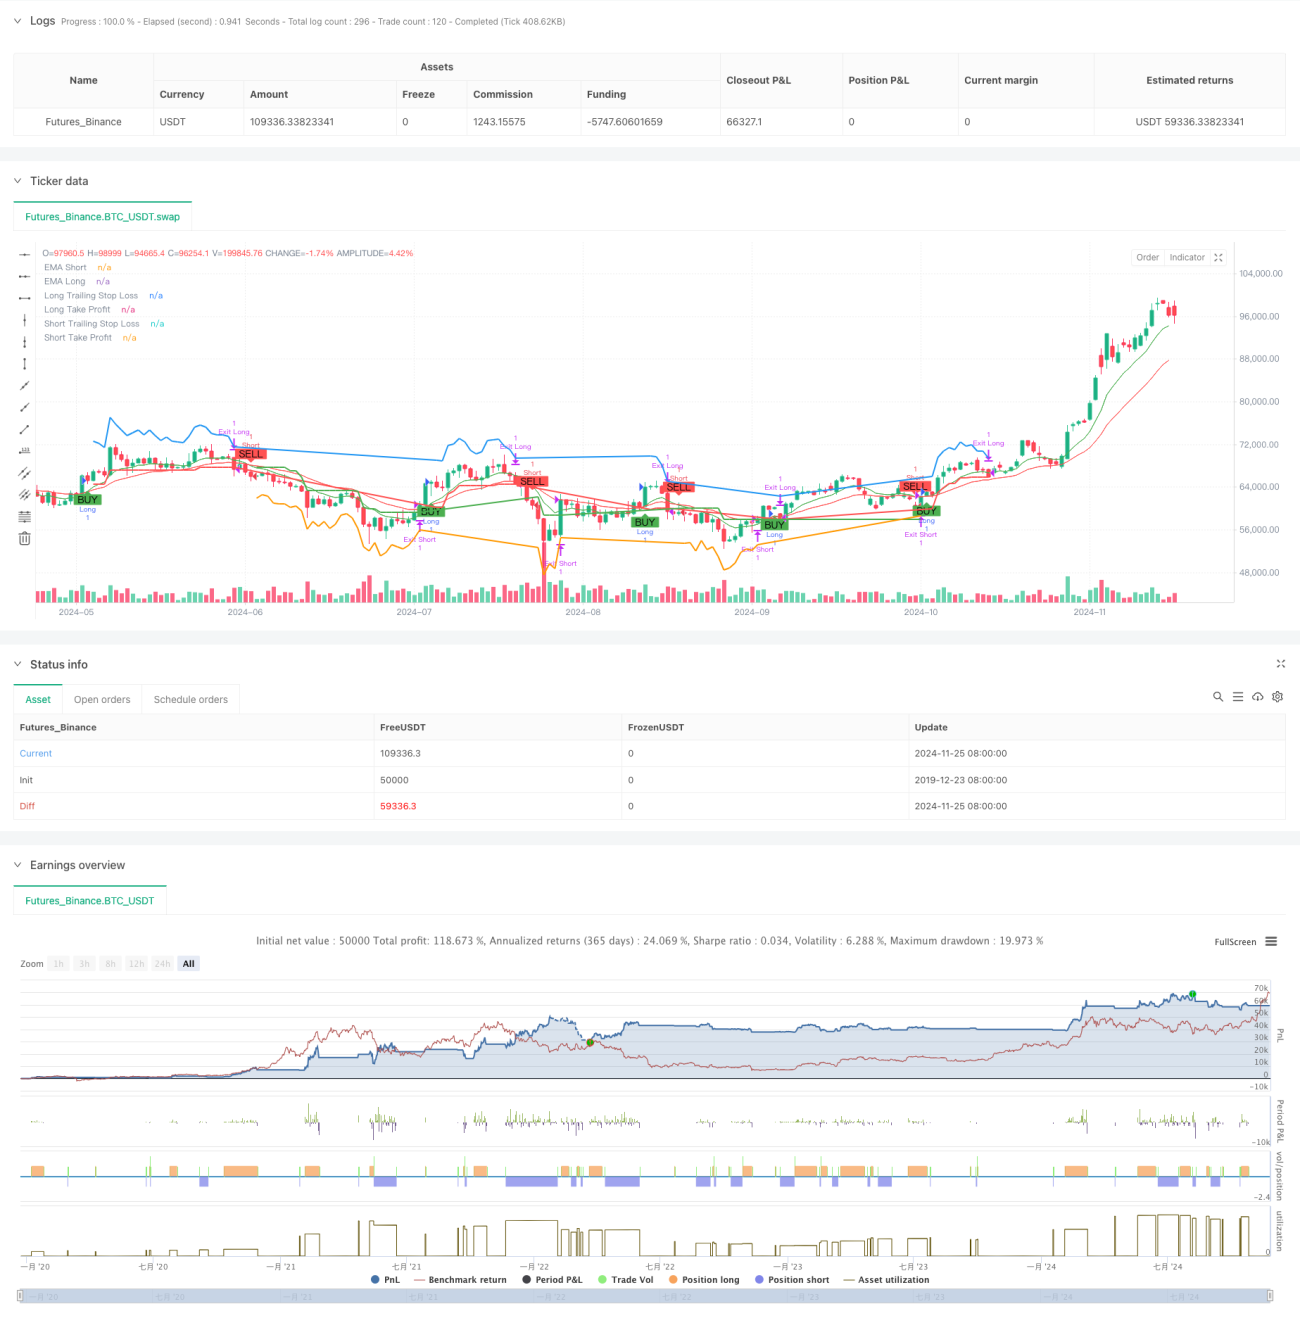
یہ ایک ٹرینڈ ٹریکنگ حکمت عملی ہے جو کثیر دورانیہ تجزیہ اور اتار چڑھاؤ کے انتظام کو جوڑتی ہے۔ حکمت عملی کا مرکز دوہری مساوی لائن کراسنگ ٹرینڈ کی سمت کا تعین کرتا ہے ، آر ایس آئی اشارے کے ذریعہ اوور خرید اوور فروخت فلٹر کرتا ہے ، اعلی ٹائم پیریڈ ای ایم اے کو مجموعی رجحان کی تصدیق کرتا ہے ، اور اے ٹی آر اشارے کو متحرک طور پر اسٹاپ نقصانات اور منافع کے اہداف کا انتظام کرنے کے لئے استعمال کرتا ہے۔ یہ حکمت عملی متعدد تکنیکی اشارے کے ساتھ مل کر کام کرتی ہے ، جس سے تجارتی سگنل کی وشوسنییتا کو یقینی بنایا جاتا ہے اور خطرے پر موثر کنٹرول حاصل ہوتا ہے۔
حکمت عملی کا اصول
اس حکمت عملی کے بنیادی تجارتی منطق کو مندرجہ ذیل اہم حصوں میں تقسیم کیا گیا ہے:
- رجحان کی شناخت: مختصر مدت اور طویل مدت کے ای ایم اے کے کراس کا استعمال کرتے ہوئے رجحان کی تبدیلی کی شناخت کے لئے ، جب قلیل مدتی ای ایم اے پر طویل مدتی ای ایم اے پہنتے ہیں تو ایک سے زیادہ سگنل پیدا ہوتا ہے ، اور جب نیچے پہنتے ہیں تو ایک خالی سگنل پیدا ہوتا ہے۔
- رجحان کی تصدیق: ایک رجحان فلٹر کے طور پر اعلی ٹائم پیریڈ ای ایم اے کو متعارف کرایا گیا ہے ، اور صرف اس وقت زیادہ کرنے کی اجازت دی گئی ہے جب قیمت اعلی ٹائم پیریڈ ای ایم اے کے اوپر ہو ، اور اس کے برعکس ، خالی کرنے کی اجازت دی گئی ہے۔
- اتار چڑھاؤ کی شرح فلٹرنگ: RSI اشارے کا استعمال کرتے ہوئے اوورلوڈ اور اوورلوڈ فیصلے کرنے کے لئے ، اور اس سے بچنے سے بچنے کے لئے کہ وہ زیادہ سے زیادہ پیچھا کرنے کے لئے نیچے کی طرف جائیں۔
- پوزیشن مینجمنٹ: اے ٹی آر کی بنیاد پر متحرک طور پر قائم کردہ اسٹاپ اور منافع کے اہداف ، قیمت میں تبدیلی کے ساتھ خود بخود اسٹاپ پوزیشن کو ایڈجسٹ کرتے ہیں ، جو منافع بخش اور غیر منافع بخش دونوں کو محفوظ کرتا ہے۔
- کثیر جہتی تحفظ: حکمت عملی متعدد تکنیکی اشارے کے جامع استعمال کے ذریعے ایک مکمل تجارتی فیصلہ سازی کا نظام تشکیل دیتی ہے۔
اسٹریٹجک فوائد
- اعلی سگنل کی وشوسنییتا: ایک سے زیادہ تکنیکی اشارے کے ساتھ مل کر ٹریڈنگ سگنل کی وشوسنییتا میں نمایاں اضافہ ہوا ہے۔
- خطرہ کنٹرول میں بہتری: اے ٹی آر پر مبنی متحرک اسٹاپ سسٹم کا استعمال کرتے ہوئے ، مارکیٹ میں اتار چڑھاؤ کے مطابق اسٹاپ پوزیشن کو ایڈجسٹ کرنے کے قابل۔
- رجحانات کی گرفتاری کی درستگی: کثیر دورانیہ تجزیہ کے طریقوں کا استعمال کرتے ہوئے ، اہم رجحانات کی درستگی میں اضافہ ہوا ہے۔
- منافع بخش اہداف لچکدار ہیں: ٹیک منافع کی ترتیب بھی اے ٹی آر کی متحرک ایڈجسٹمنٹ پر مبنی ہے ، جو منافع بخش ہونے کی ضمانت کے ساتھ ساتھ جلد بازی سے باہر نہیں نکلتی ہے۔
- لچکدار: حکمت عملی کے پیرامیٹرز کو ایڈجسٹ کیا جاسکتا ہے ، جو مختلف مارکیٹ کے حالات کے مطابق ڈھال سکتا ہے۔
اسٹریٹجک رسک
- مارکیٹ میں ہلچل کا خطرہ: ہلچل کے حالات میں اکثر تجارت سے نقصان ہوسکتا ہے۔
- سلائڈ پوائنٹ کا خطرہ: شدید اتار چڑھاؤ کے دوران ، اصل سودے کی قیمتوں میں نظریاتی قیمتوں سے زیادہ انحراف ہوسکتا ہے۔
- جھوٹے بریک آؤٹ کا خطرہ: ممکنہ طور پر قلیل مدتی بریک آؤٹ کے بعد الٹ جانا ، جس سے نقصان کا خاتمہ ہوتا ہے۔
- پیرامیٹرز کی حساسیت: مختلف پیرامیٹرز کے مجموعے حکمت عملی کی کارکردگی پر بہت زیادہ اثر ڈالتے ہیں اور انہیں اچھی طرح سے جانچنے کی ضرورت ہے۔
حکمت عملی کی اصلاح کی سمت
- مارکیٹ کے ماحول کی شناخت: رجحان کی طاقت کے اشارے شامل کریں ، خود بخود اپنی پوزیشنوں کو کم کریں یا ہلکے بازار میں تجارت کو روکیں۔
- انٹری ٹائمنگ کو بہتر بنائیں: انٹری سگنل کی وشوسنییتا کو بہتر بنانے کے لئے ٹریفک کی مقدار کے اشارے کو جوڑ سکتے ہیں۔
- متحرک پیرامیٹرز کی ایڈجسٹمنٹ: مارکیٹ میں اتار چڑھاؤ کی شرح کے مطابق ای ایم اے کی مدت اور اے ٹی آر کی ضرب کو خود بخود ایڈجسٹ کیا جاسکتا ہے۔
- اسٹیک ہولڈنگ سسٹم: اسٹیک ہولڈنگ اور ہولڈنگ کے طریقہ کار کو ڈیزائن کیا جاسکتا ہے ، جس سے قیمتوں میں ایک ہی نقطہ کے خطرے کو کم کیا جاسکتا ہے۔
- پوزیشن مینجمنٹ کو بہتر بنائیں: اکاؤنٹ کے خطرے اور مارکیٹ میں اتار چڑھاؤ کی بنیاد پر پوزیشن کا سائز ایڈجسٹ کریں۔
خلاصہ کریں۔
یہ ایک اچھی طرح سے ڈیزائن کیا گیا رجحان کی پیروی کی حکمت عملی ہے ، جس میں کثیر دورانیہ تجزیہ اور اتار چڑھاؤ کے انتظام کے ذریعہ بہتر رسک کمائی کی خصوصیت حاصل کی گئی ہے۔ حکمت عملی کا بنیادی فائدہ متعدد تکنیکی اشارے کا نامیاتی امتزاج ہے ، جو تجارت کی وشوسنییتا کو یقینی بناتا ہے اور خطرے پر موثر کنٹرول حاصل کرتا ہے۔ اگرچہ کچھ ممکنہ خطرات موجود ہیں ، لیکن اس حکمت عملی کی مجموعی کارکردگی کو بہتر بنانے کے لئے جگہ موجود ہے۔
- 1