بولنگر بینڈز اور رشتہ دار طاقت کا امتزاج تجارتی حکمت عملی

جائزہ
یہ حکمت عملی بولنگر بینڈ اور نسبتا weak مضبوط اشارے آر ایس آئی کو جوڑ کر ایک مکمل تجارتی نظام تشکیل دیتی ہے۔ حکمت عملی بنیادی طور پر مارکیٹ میں اتار چڑھاؤ اور حرکیات کی تبدیلیوں کو پکڑ کر تجارتی مواقع کی تلاش کرتی ہے ، خاص طور پر دن کے تاجروں کے لئے موزوں ہے۔ بولنگر کے ذریعہ مارکیٹ میں اتار چڑھاؤ کی پیمائش کرتے ہوئے ، آر ایس آئی کے ساتھ مل کر قیمتوں کی اوور بیئر اوور سیل کی تصدیق کرتے ہیں ، جس سے زیادہ قابل اعتماد تجارتی سگنل پیدا ہوتے ہیں۔
حکمت عملی کا اصول
اس حکمت عملی کا بنیادی منطق قیمت کی اتار چڑھاؤ کے اشارے کو متحرک اشارے کے ساتھ جوڑنا ہے۔ پولین بینڈ 20 دن کی سادہ حرکت پذیر اوسط کے ساتھ ایک وسط ٹریل کے طور پر استعمال کیا جاتا ہے ، اور اوپر اور نیچے کی سمت 2.5 گنا معیاری فرق ہے۔ جب قیمت نیچے کی طرف جاتی ہے اور RSI 30 سے کم ہوتا ہے تو ، نظام ایک کثیر سگنل جاری کرتا ہے۔ جب قیمت ٹریک کو توڑتی ہے اور RSI 70 سے زیادہ ہوتی ہے تو ، نظام ایک فلیٹ پوزیشن سگنل جاری کرتا ہے۔ اس کے علاوہ ، اس حکمت عملی میں اضافی فلیٹ پوزیشن کی شرائط بھی رکھی گئی ہیں جب RSI 50 سے زیادہ ہوجاتی ہے ، جس سے منافع کو وقت پر بند کرنے میں مدد ملتی ہے۔ حکمت عملی کا ڈیزائن مارکیٹ کی اتار چڑھاؤ کی خصوصیات اور قیمتوں میں تبدیلی کے قوانین کو مکمل طور پر مدنظر رکھتا ہے۔
اسٹریٹجک فوائد
- اعلی سگنل کی وشوسنییتا: دو مختلف جہتوں کے تکنیکی اشارے کو ملا کر ٹریڈنگ سگنل کی وشوسنییتا میں نمایاں اضافہ
- بہتر خطرے پر قابو: واضح داخلے اور باہر نکلنے کی شرائط جذباتی تجارت کے اثرات کو کم کرتی ہیں
- لچکدار: حکمت عملی کے پیرامیٹرز کو مختلف مارکیٹ کے حالات کے مطابق لچک سے ایڈجسٹ کیا جاسکتا ہے
- آپریٹنگ منطق کی وضاحت: ٹریڈنگ کے قواعد واضح ہیں ، ان پر عمل درآمد اور پیمائش کرنا آسان ہے
- معقول منافع رسک: معقول اسٹاپ نقصان کی شرائط کی ترتیب کے ذریعہ ایک اچھا منافع رسک یقینی بنانا
اسٹریٹجک رسک
- مارکیٹ میں ہلچل کا خطرہ: شدید اتار چڑھاؤ کے ساتھ غلط سگنل پیدا ہوسکتے ہیں
- رجحان سازی مارکیٹ کا خطرہ: مضبوط رجحان سازی مارکیٹوں میں، کچھ حصوں کو یاد کیا جا سکتا ہے
- پیرامیٹر حساسیت: حکمت عملی کے اثرات پیرامیٹرز کی ترتیبات کے لئے حساس ہیں اور مسلسل اصلاح کی ضرورت ہے
- سلائڈ پوائنٹ اثر: کم لیکویڈیٹی والے بازاروں میں زیادہ سلائڈ پوائنٹس کا سامنا کرنا پڑ سکتا ہے
- سسٹمیٹک رسک: مارکیٹ میں اچانک ہونے والے واقعات حکمت عملی کو ناکام بنا سکتے ہیں
حکمت عملی کی اصلاح کی سمت
- متحرک پیرامیٹرز کی اصلاح: مارکیٹ میں اتار چڑھاؤ کی شرح کے مطابق متحرک طور پر ایڈجسٹ کرنے کے لئے پولن بینڈ کے پیرامیٹرز پر غور کیا جاسکتا ہے
- رجحانات کو فلٹر کریں: رجحانات کے فیصلے کے اشارے متعارف کروائیں تاکہ مضبوط رجحانات والے بازاروں میں غلط سگنل سے بچا جاسکے
- نقصان کو روکنے کے طریقہ کار کو بہتر بنائیں: زیادہ لچکدار نقصان کی روک تھام کی حکمت عملی تیار کریں اور فنڈز کو زیادہ موثر طریقے سے استعمال کریں
- سگنل کی تصدیق کو بہتر بنانا: سگنل کی وشوسنییتا کو بہتر بنانے کے لئے ٹریفک کی تعداد میں اضافہ جیسے معاون اشارے
- فروخت کی حکمت عملی کو بہتر بنائیں: منافع کے زیادہ تفصیلی اہداف اور اسٹاپ نقصان کی شرائط تیار کریں
خلاصہ کریں۔
یہ حکمت عملی بولین بینڈ اور آر ایس آئی اشارے کو ہوشیار طریقے سے جوڑ کر ، ایک منطقی سخت اور عملی طور پر مضبوط تجارتی نظام تشکیل دیتی ہے۔ حکمت عملی کے بنیادی فوائد سگنل کی اعلی وشوسنییتا ، خطرے پر قابو پانے کے ساتھ ساتھ مضبوط موافقت ہیں۔ اگرچہ کچھ مارکیٹ کے حالات میں کچھ چیلنجوں کا سامنا کرنا پڑ سکتا ہے ، لیکن مسلسل اصلاح اور بہتری کے ذریعہ ، حکمت عملی کی مجموعی کارکردگی بہتر اطلاق کی قدر ہے۔ یہ تجویز کی جاتی ہے کہ تاجر مارکیٹ کے ماحول میں ہونے والی تبدیلیوں پر دھیان دیں ، حکمت عملی کے پیرامیٹرز کو لچکدار انداز میں ایڈجسٹ کریں ، اور ہمیشہ خطرے پر قابو پائیں۔
Overview
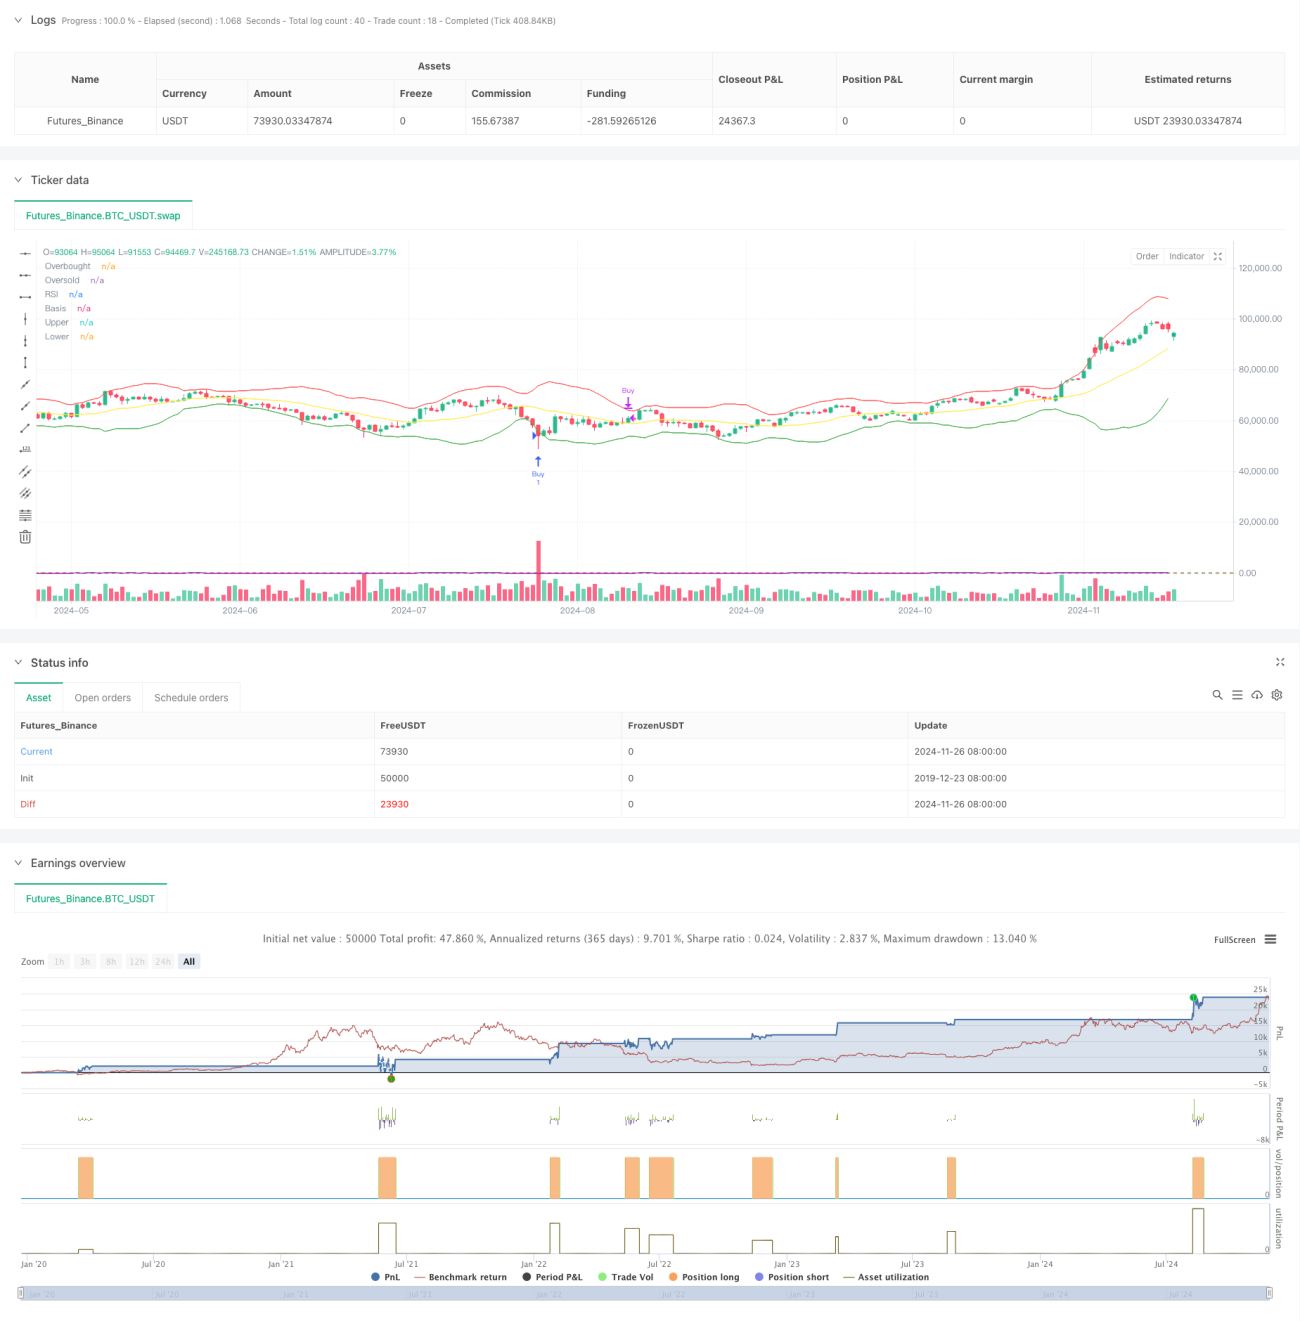
This strategy combines Bollinger Bands and Relative Strength Index (RSI) to form a comprehensive trading system. It primarily seeks trading opportunities by capturing market volatility and momentum changes, particularly suitable for intraday traders. The strategy uses Bollinger Bands to measure market volatility while incorporating RSI to confirm overbought and oversold conditions, generating more reliable trading signals.
Strategy Principles
The core logic combines volatility and momentum indicators. Bollinger Bands consist of a 20-day simple moving average as the middle band, with upper and lower bands set at 2.5 standard deviations. Buy signals are generated when price touches the lower band and RSI is below 30, while exit signals occur when price breaks above the upper band and RSI exceeds 70. Additionally, the strategy includes an extra exit condition when RSI rises above 50, helping to secure profits. The design thoroughly considers market volatility characteristics and price momentum patterns.
Strategy Advantages
- High Signal Reliability: Combining two different technical indicators significantly improves trading signal reliability
- Comprehensive Risk Control: Clear entry and exit conditions effectively reduce emotional trading
- Strong Adaptability: Strategy parameters can be flexibly adjusted for different market conditions
- Clear Operational Logic: Trading rules are explicit, easy to execute and backtest
- Reasonable Risk-Reward Ratio: Appropriate profit-taking and stop-loss conditions ensure a favorable risk-reward ratio
Strategy Risks
- Choppy Market Risk: May generate false signals in highly volatile market conditions
- Trend Market Risk: Might miss some opportunities in strong trending markets
- Parameter Sensitivity: Strategy performance is sensitive to parameter settings, requiring continuous optimization
- Slippage Impact: May face significant slippage in markets with poor liquidity
- Systematic Risk: Market emergencies may cause strategy failure
Strategy Optimization Directions
- Dynamic Parameter Optimization: Consider dynamically adjusting Bollinger Bands parameters based on market volatility
- Add Trend Filters: Introduce trend identification indicators to avoid false signals in strong trending markets
- Improve Stop Loss Mechanism: Design more flexible stop-loss strategies to enhance capital efficiency
- Optimize Signal Confirmation: Add volume and other auxiliary indicators to improve signal reliability
- Enhance Exit Strategy: Design more detailed profit targets and stop-loss conditions
Summary
The strategy cleverly combines Bollinger Bands and RSI indicators to build a logically rigorous and highly operable trading system. Its main advantages lie in high signal reliability and comprehensive risk control, while maintaining strong adaptability. Although it may face challenges in certain market environments, the strategy maintains good practical value through continuous optimization and improvement. Traders should pay attention to changing market conditions, flexibly adjust strategy parameters, and always maintain proper risk control in practical applications.
- 1