حکمت عملی کے بعد ڈبل اسموتھنگ اوسط رجحان - بہتر پنگ این جیانگ کی K-لائن پر مبنی

جائزہ
یہ حکمت عملی ایک ترمیم شدہ ہیکن-اشی پر مبنی رجحان ٹریکنگ سسٹم ہے۔ روایتی ہیکن-اشی کے ساتھ ڈبل اشاریہ منتقل اوسط (ای ایم اے) ہموار کرکے مارکیٹ میں شور کو مؤثر طریقے سے کم کریں ، اور واضح رجحان سگنل فراہم کریں۔ حکمت عملی صرف ایک سے زیادہ طریقوں سے کام کرتی ہے ، بڑھتے ہوئے رجحان میں پوزیشن رکھتی ہے ، گرنے والے رجحان میں فلیٹ پوزیشن کی توقع کرتی ہے ، اور موثر رجحان پر قبضہ کرکے مارکیٹ سے فائدہ اٹھاتی ہے۔
حکمت عملی کا اصول
حکمت عملی کی بنیادی منطق میں درج ذیل کلیدی اقدامات شامل ہیں:
- او ایچ ایل سی قیمتوں کے اعداد و شمار پر پہلی بار ای ایم اے ہموار کرنا
- ہموار ہونے کے بعد قیمتوں کا حساب لگانے کے لئے بہتر پنگ یانگسی K لائن
- پیانگ یانگ کی K لائن پر سیکنڈری EMA ہموار کریں
- K لائن کے رنگ میں تبدیلی کا فیصلہ کرنے کے لئے کھلنے اور بند ہونے والی قیمتوں کا موازنہ کریں
- K لائن پر سرخ سے سبز ہونے پر خرید کا اشارہ ہوتا ہے اور سبز سے سرخ ہونے پر فروخت کا اشارہ ہوتا ہے
- اکاؤنٹ کی کل مالیت کے 100٪ پوزیشن پر تجارت کرنا
اسٹریٹجک فوائد
- دوہری ہموار نمایاں طور پر جعلی سگنل کو کم کرتا ہے
- صرف ایک سے زیادہ حکمت عملیوں کے ساتھ، آپ کو غیر فعال ہونے کا خطرہ کم ہوسکتا ہے.
- رجحان کی تصدیق کے بعد ہی کھیل میں داخل ہوں ، جیت کی شرح میں اضافہ کریں
- مکمل سگنلنگ سسٹم خودکار تجارت کی حمایت کرتا ہے
- مختلف ٹرانزیکشن کی ضروریات کو پورا کرنے کے لئے لچکدار وقت کی مدت کا انتخاب
- سادہ اور واضح قوانین کو آسانی سے نافذ کیا جا سکتا ہے
- مختلف مارکیٹ کے حالات کے تحت فنڈز کے انتظام کی حمایت کرنا
اسٹریٹجک رسک
- رجحان کی تبدیلی کے ابتدائی مرحلے میں ایک بڑی واپسی کا امکان ہے
- ہلچل مچانے والی مارکیٹوں میں مسلسل غلط سگنل پیدا ہو سکتے ہیں
- مکمل پوزیشن ٹریڈنگ کے ذریعہ فنڈز کا خطرہ بڑھتا ہے
- انٹری سگنل کی تاخیر سے کچھ اضافے کی کمی ہوسکتی ہے
- مختلف ٹائم پیکیجز میں نمایاں فرق
حکمت عملی کی اصلاح کی سمت
- رجحان کی طاقت کے فلٹرز کو متعارف کرانے سے مارکیٹ میں جھوٹے سگنل کم ہوجائیں گے
- متحرک ہولڈنگ مینجمنٹ میں اضافہ اور فنڈز کے استعمال کو بہتر بنانا
- موبائل سٹاپ نقصان کا اضافہ، واپسی کے خطرے پر قابو پانا
- دیگر تکنیکی اشارے کے ساتھ مل کر سگنل کی تاثیر کی تصدیق
- حکمت عملی کے استحکام کو بہتر بنانے کے لئے موافقت پذیر پیرامیٹر سسٹم تیار کریں
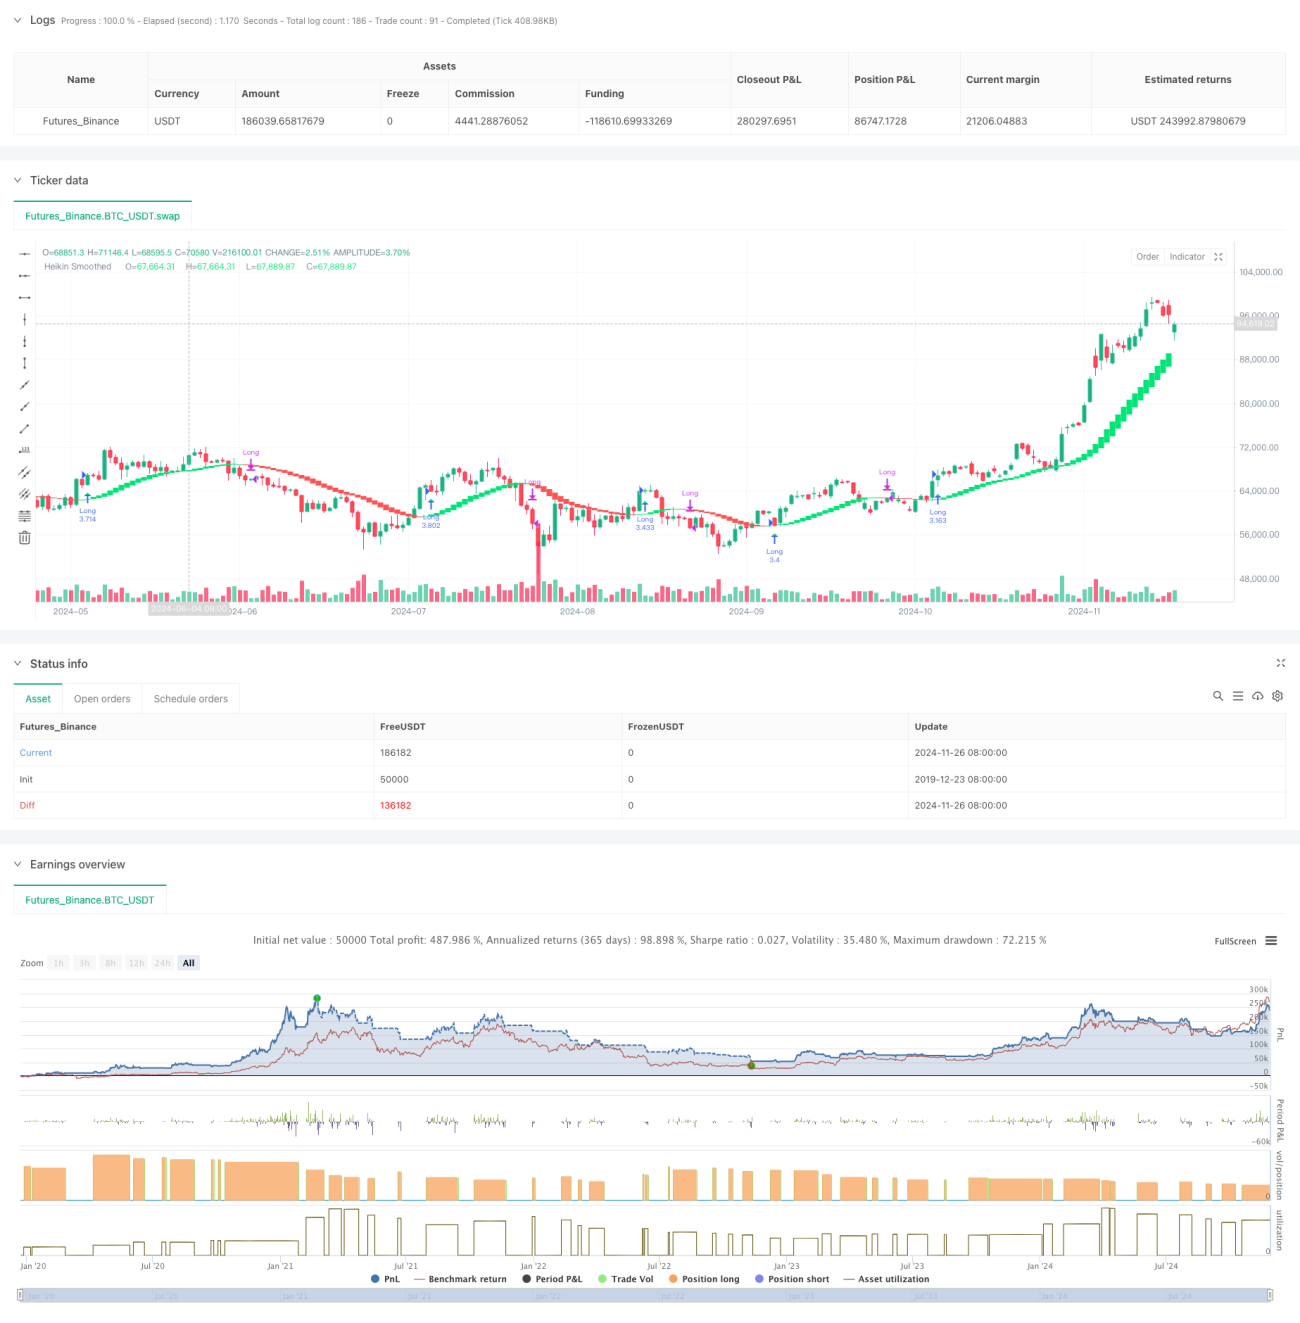
خلاصہ کریں۔
اس حکمت عملی میں دوہری ہموار اور بہتر پیانگ یانگ کی لائن کے ذریعہ ایک مضبوط رجحان ٹریکنگ سسٹم بنایا گیا ہے۔ اس حکمت عملی کا ڈیزائن واضح ، سمجھنے اور عمل کرنے میں آسان ہے ، اور مختلف مارکیٹ کے حالات کے مطابق ڈھالنے کے لئے متعدد اصلاحی سمتیں پیش کی گئی ہیں۔ اگرچہ کچھ پسماندہ اور واپسی کا خطرہ موجود ہے ، لیکن مناسب فنڈ مینجمنٹ اور رسک کنٹرول اقدامات کے ذریعہ ، یہ حکمت عملی سرمایہ کاروں کو ایک قابل اعتماد رجحان ٹریکنگ ٹول فراہم کرنے میں کامیاب ہے۔
/*backtest
start: 2019-12-23 08:00:00
end: 2024-11-27 08:00:00
period: 1d
basePeriod: 1d
exchanges: [{"eid":"Futures_Binance","currency":"BTC_USDT"}]
*/

//@version=5
strategy("Smoothed Heiken Ashi Strategy Long Only", overlay=true, initial_capital=1000, default_qty_type=strategy.percent_of_equity, default_qty_value=100)

len = input.int(10, title="EMA Length")- 1