ڈوئل چین ہائبرڈ مومنٹم موونگ ایوریج فالونگ ٹریڈنگ سسٹم

جائزہ
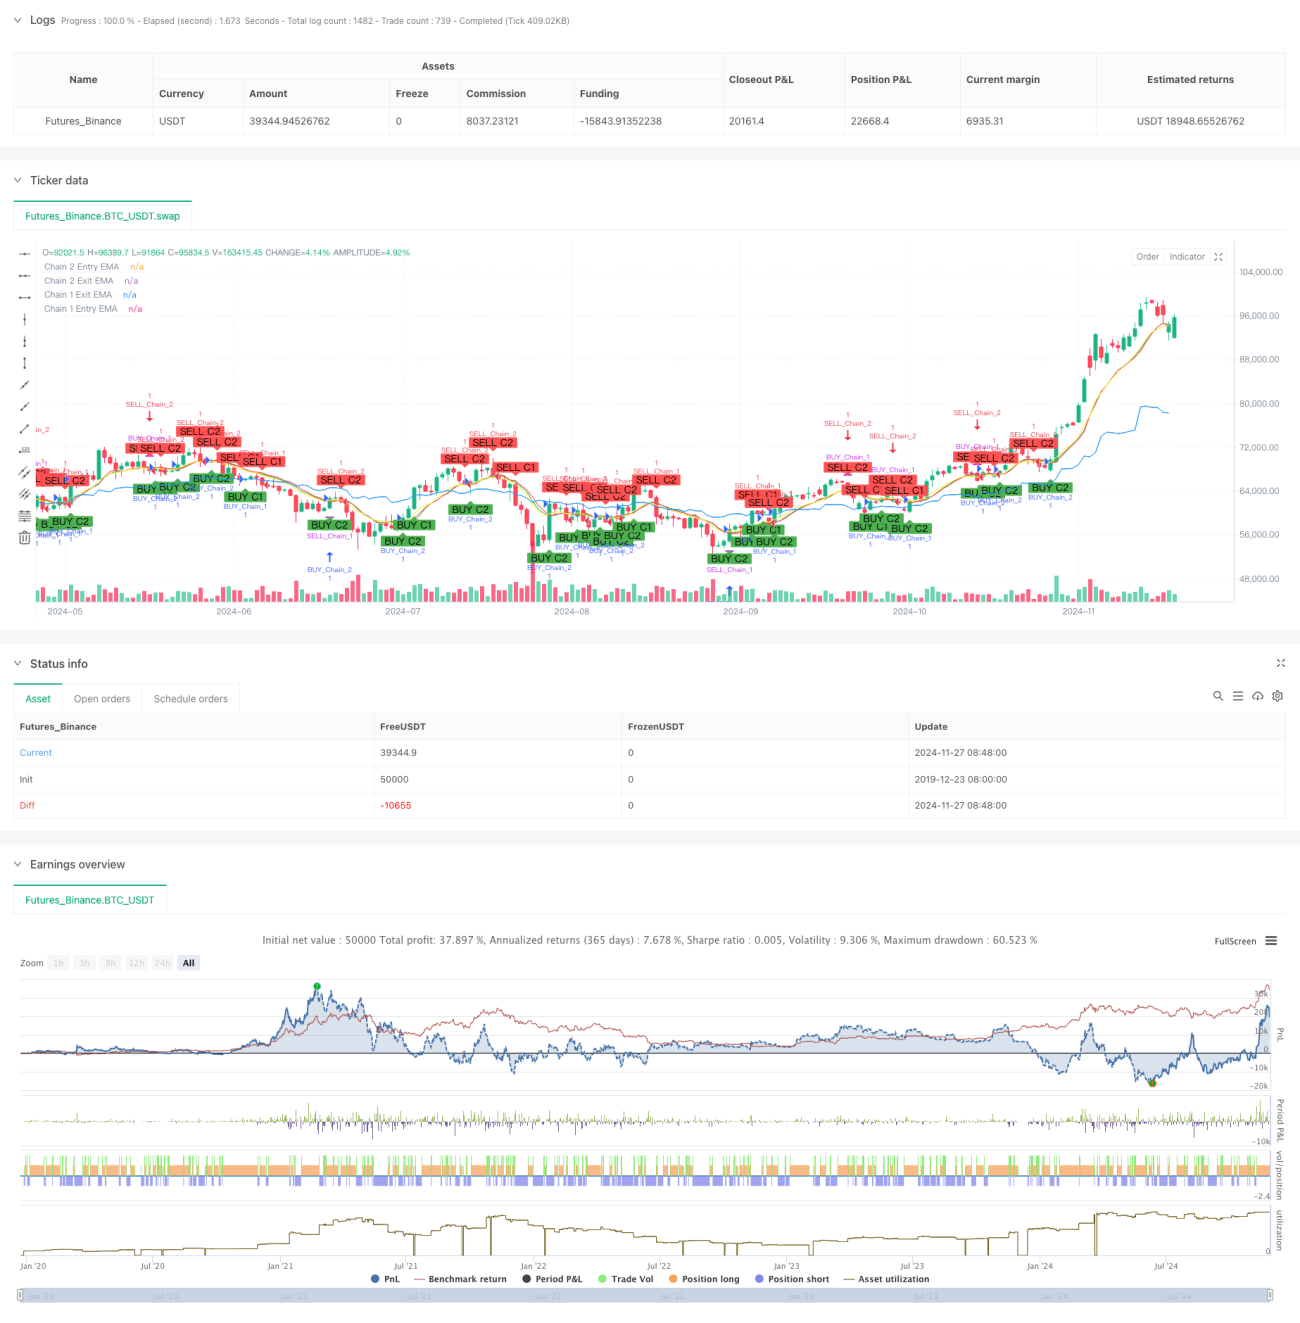
یہ حکمت عملی ایک جدید ٹریڈنگ سسٹم ہے جو اشاریہ منتقل اوسط ((ای ایم اے) پر مبنی ہے ، جس میں مختلف ٹائم فریموں میں دو الگ الگ ٹریڈنگ چینز قائم کرکے مارکیٹ کے مواقع کو پکڑنے کے لئے استعمال کیا جاتا ہے۔ حکمت عملی طویل مدتی رجحانات کی پیروی اور قلیل مدتی حرکت پذیری کی تجارت کے فوائد کو مربوط کرتی ہے ، جس سے ہفتہ وار ، دن کی لکیر ، 12 گھنٹے اور 9 گھنٹے جیسے متعدد ٹائم فریموں پر ای ایم اے کے کراسنگ کے ذریعہ تجارتی سگنل پیدا ہوتے ہیں ، جس سے مارکیٹ کے کثیر جہتی تجزیہ اور گرفت کو ممکن بنایا جاتا ہے۔
حکمت عملی کا اصول
حکمت عملی دوہری سلسلہ ڈیزائن پر مبنی ہے، جس میں سے ہر ایک میں ان کے اپنے منفرد داخلہ اور آؤٹ پٹ منطق ہے:
سلسلہ 1 ((طویل مدتی رجحانات) گھڑی اور دن کی لکیر کا استعمال کرتے ہوئے:
- انٹری سگنل: جب بندش کی قیمت گھومنے والی لائن پر ای ایم اے پہنتی ہے تو ایک کثیر سگنل پیدا ہوتا ہے
- ایکسٹریم سگنل: جب بندش کی قیمت ای ایم اے کو سورج کی لکیر کے تحت ٹرانسفر کرتی ہے تو ایک پلے اسٹاک سگنل پیدا ہوتا ہے
- ڈیفالٹ ای ایم اے کی مدت 10 ہے، ضرورت کے مطابق ایڈجسٹ کیا جا سکتا ہے
سلسلہ 2 ((قلیل مدتی حرکیات) 12 گھنٹے اور 9 گھنٹے کے دورانیے کا استعمال کرتے ہوئے:
- انٹری سگنل: جب بندش کی قیمت 12 گھنٹے کے دورانیے پر ای ایم اے پہنتی ہے تو ایک کثیر سگنل پیدا ہوتا ہے
- ایکسٹینشن سگنل: جب بندش کی قیمت 9 گھنٹے کے دورانیے پر EMA سے گزرتی ہے تو اس میں ایک پلے اسٹاک سگنل پیدا ہوتا ہے
- پہلے سے طے شدہ ای ایم اے کی مدت 9 ہے ، جو ضرورت کے مطابق ایڈجسٹ کی جاسکتی ہے
اسٹریٹجک فوائد
- کثیر جہتی مارکیٹ تجزیہ: مختلف ٹائم پیکیجز کے مجموعے کے ذریعے مارکیٹ کے رجحانات کا مکمل اندازہ لگانا
- لچکدار: دو زنجیروں کو آزادانہ طور پر فعال یا غیر فعال کیا جاسکتا ہے ، جو مختلف طرز کے کاروبار کے مطابق ہے
- بہتر خطرے کا کنٹرول: غلط سگنل کے خطرے کو کم کرنے کے لئے کثیر وقت کی مدت کی توثیق
- پیرامیٹرز ایڈجسٹ: ای ایم اے کی مدت اور وقت کی مدت دونوں کو ضرورت کے مطابق تبدیل کیا جاسکتا ہے
- بہتر ریٹرننگ: بلٹ ان ریٹرننگ کے دوران سیٹ اپ ، حکمت عملی کی توثیق اور اصلاح کے لئے
اسٹریٹجک رسک
- رجحان کے الٹ جانے کا خطرہ: شدید اتار چڑھاؤ والے بازاروں میں تاخیر کا امکان
- ٹائم سائیکل کی ترتیب کا خطرہ: مختلف مارکیٹوں میں مختلف ٹائم سائیکل کا مجموعہ درکار ہوسکتا ہے
- پیرامیٹرز کو بہتر بنانے کا خطرہ: ضرورت سے زیادہ اصلاح سے زیادہ فٹ ہونے کا خطرہ
- سگنل اوورلیپنگ کا خطرہ: ایک ہی وقت میں دو زنجیروں کو متحرک کرنے سے پوزیشن رکھنے کا خطرہ بڑھ سکتا ہے
رسک کنٹرول کی تجاویز:
- معقول اسٹاپ نقصان کا تعین کریں
- مارکیٹ کی خصوصیات کے مطابق پیرامیٹرز کو ایڈجسٹ کریں
- ریئل اسٹیشن سے پہلے مکمل ریٹرننگ کی تصدیق
- ہر لین دین کے لیے سرمائے کے تناسب کو کنٹرول کریں۔
حکمت عملی کی اصلاح کی سمت
- سگنل فلٹرنگ کی اصلاح:
- حجم کی تصدیق کا طریقہ کار شامل کریں۔
- فلٹرنگ سگنل کے لئے تعدد اشارے متعارف کرایا
- بڑھتی ہوئی رجحان کی تصدیق
- رسک کنٹرول کی اصلاح:
- متحرک سٹاپ نقصان کا طریقہ کار تیار کرنا
- پوزیشن مینجمنٹ سسٹم ڈیزائن
- واپس لینے کے کنٹرول میں اضافہ
- ٹائم سائیکل کی اصلاح:
- بہترین ٹائم سائیکل کا مجموعہ
- وقت کے دورانیے کے نظام کو تیار کرنا
- مارکیٹ کی حیثیت کی شناخت میں اضافہ
خلاصہ کریں۔
ڈبل چین ہائبرڈ اوسط لائن ٹریکنگ سسٹم ، ایک طویل اور قلیل مدتی اوسط لائن حکمت عملی کے ساتھ ایک جدید امتزاج کے ذریعے ، مارکیٹ کے کثیر جہتی تجزیہ اور گرفت کو حاصل کرتا ہے۔ نظام کا ڈیزائن لچکدار ہے ، مختلف مارکیٹ کی صورتحال اور تاجر کے انداز کے مطابق ایڈجسٹ کیا جاسکتا ہے ، اور اس کی عملی افادیت مضبوط ہے۔ معقول رسک کنٹرول اور مسلسل اصلاح کے ذریعہ ، اس حکمت عملی سے اصل تجارت میں مستحکم منافع حاصل کرنے کا امکان ہے۔
- 1