جائزہ
یہ حکمت عملی ایک جامع تجارتی نظام ہے جس میں دوہری مساوی لائن سسٹم ، نسبتا weak مضبوط اشارے ((RSI) اور نسبتا strength مضبوطی ((RS) تجزیہ شامل ہے۔ حکمت عملی 13 ویں اور 21 ویں انڈیکس کی متحرک اوسط ((EMA) کے کراس تصدیق کے رجحان کے ذریعے ، جبکہ RSI اور بیس انڈیکس کے مقابلے میں آر ایس ویلیو کے مقابلے میں تجارتی سگنل کی تصدیق کے ساتھ مل کر ، ایک کثیر جہتی تجارتی فیصلہ سازی کا طریقہ کار انجام دیتی ہے۔ حکمت عملی میں 52 ہفتوں کی اونچائی پر مبنی رسک کنٹرول میکانیزم اور دوبارہ داخلے کے حالات پر مبنی فیصلے بھی شامل ہیں۔
حکمت عملی کا اصول
حکمت عملی میں متعدد سگنل کی تصدیق کا طریقہ کار شامل ہے:
- انٹری سگنل کو مندرجہ ذیل شرائط کو ایک ساتھ پورا کرنا ہوگا:
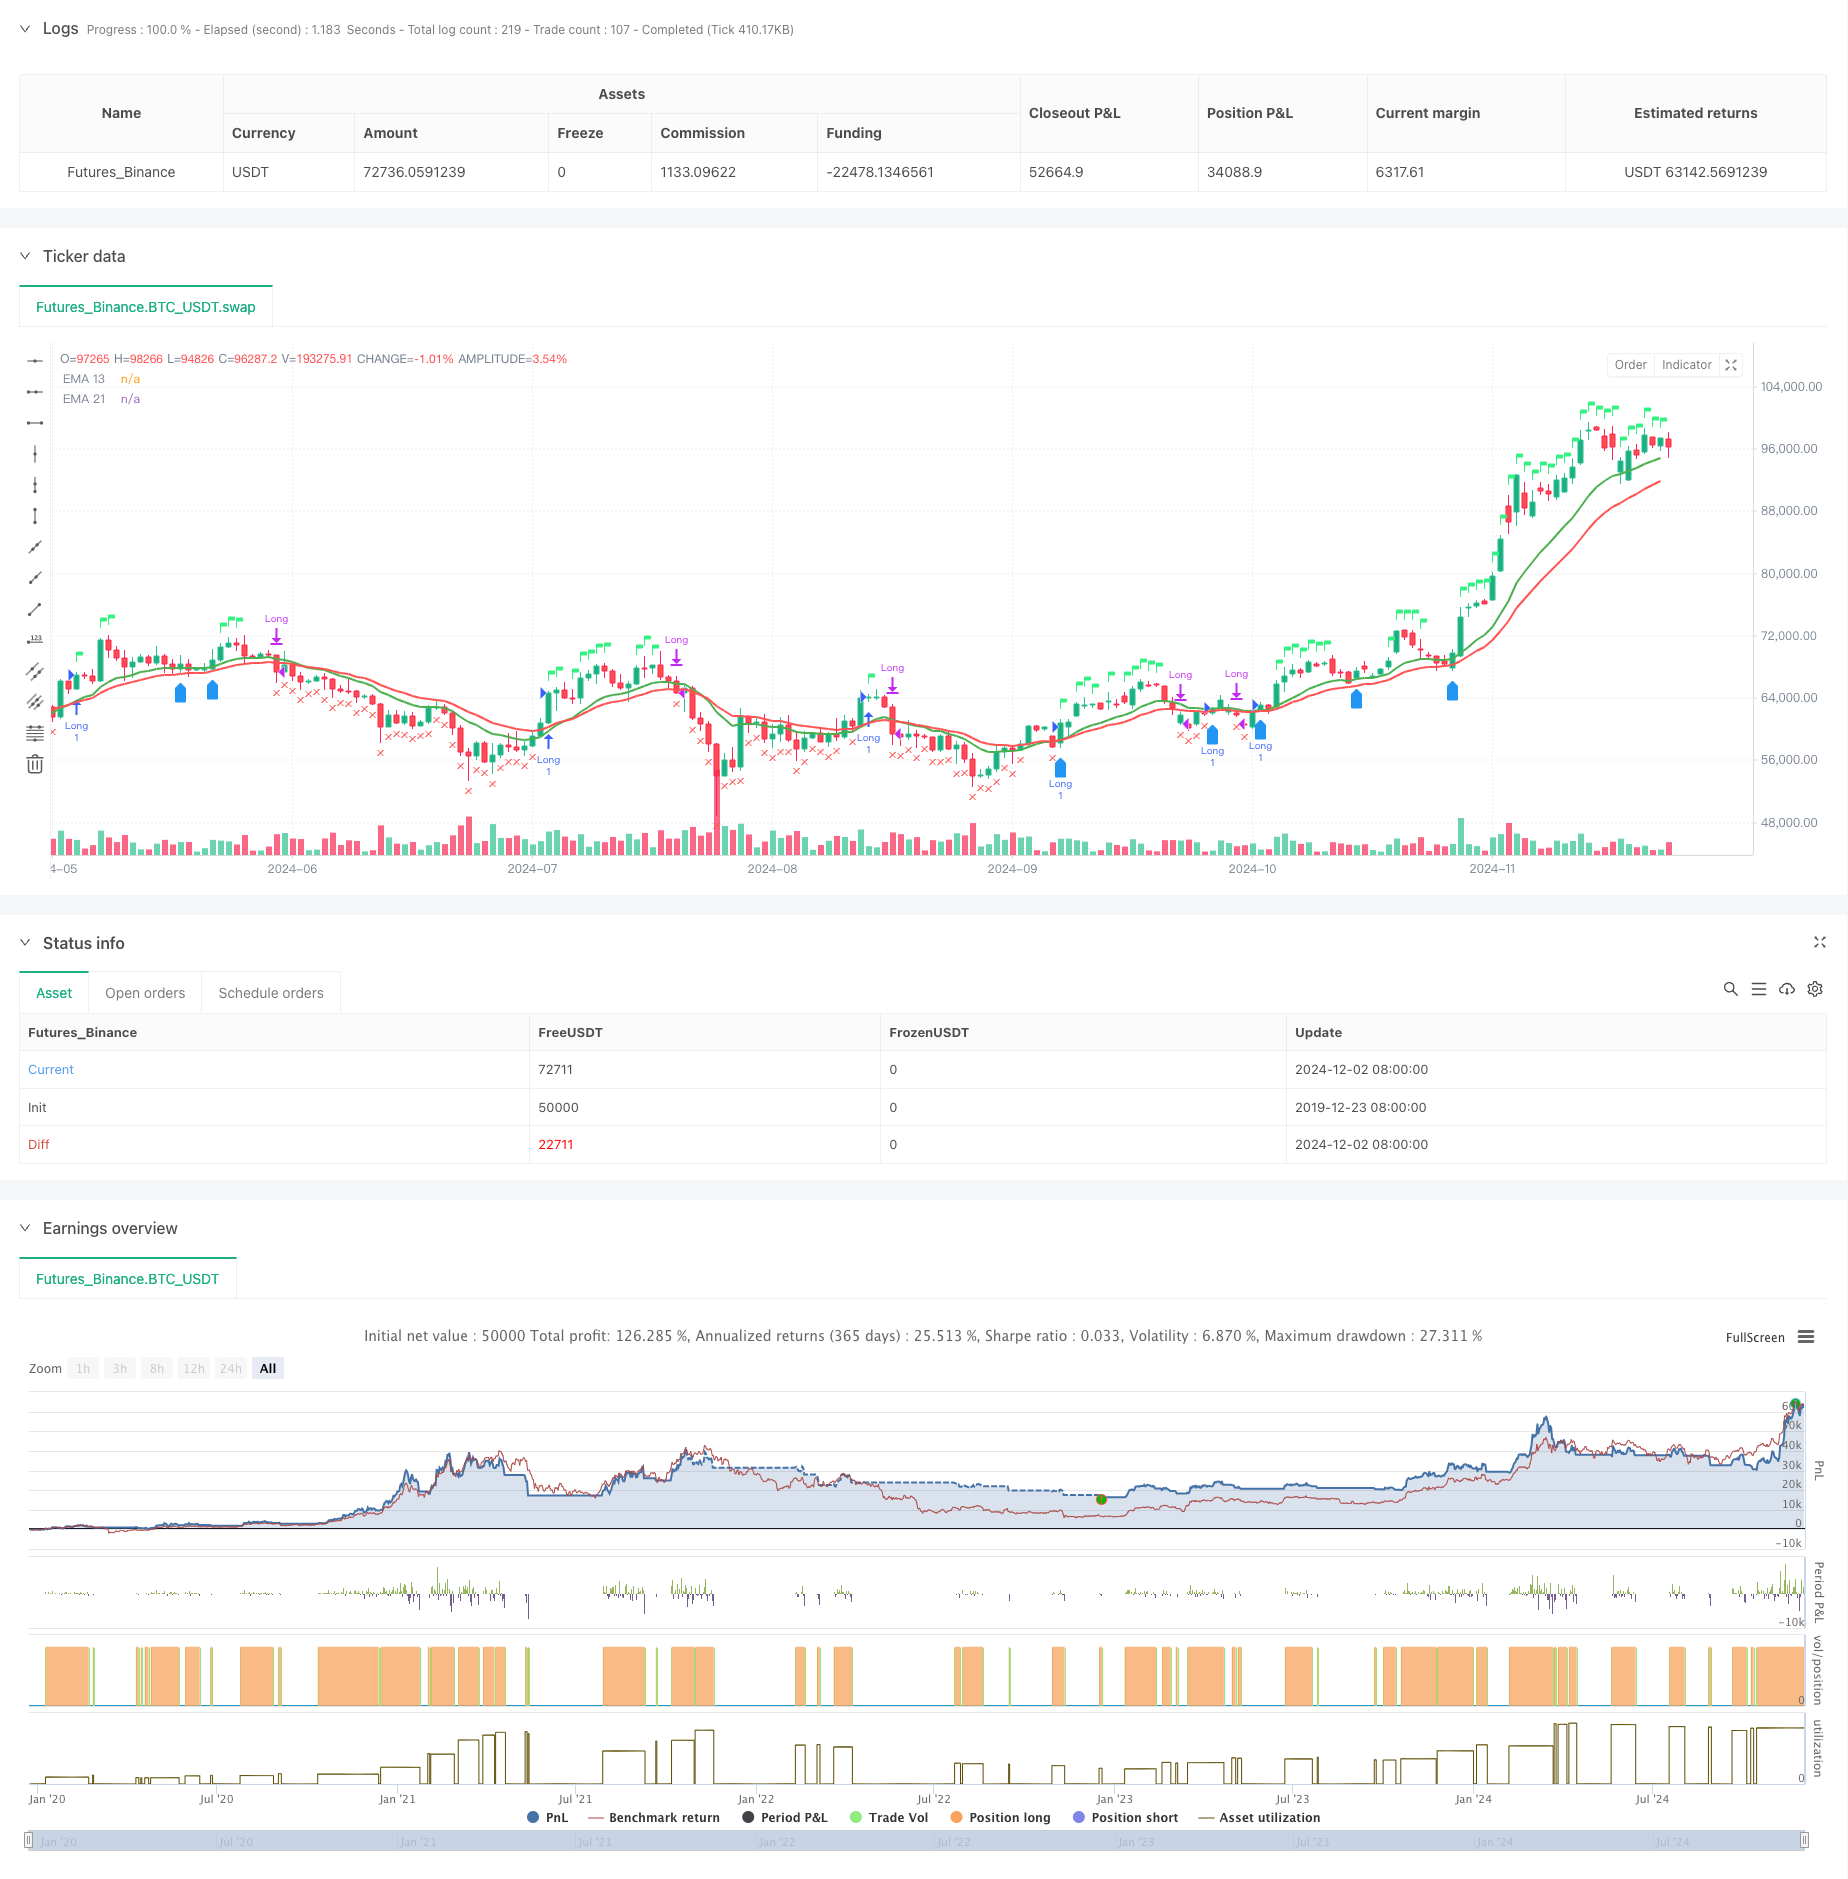
- ای ایم اے 13 پر ای ایم اے 21 پہننا یا ای ایم اے 13 سے زیادہ قیمت
- RSI 60 سے زیادہ
- رشتہ دار شدت ((RS) مثبت ہے
- انخلا کی شرائط میں شامل ہیں:
- قیمت EMA21 سے نیچے
- RSI 50 سے کم
- RS منفی میں تبدیل
- دوبارہ داخلہ کی شرائط:
- قیمت پر EMA13 پہننا اور EMA13 EMA21 سے بڑا ہے
- RS کو مثبت رکھیں
- یا قیمتوں میں پچھلے ہفتے کی بلند ترین سطح سے تجاوز
اسٹریٹجک فوائد
- ایک سے زیادہ سگنل کی تصدیق کے طریقہ کار سے جعلی دراندازی کا خطرہ کم ہوتا ہے
- نسبتاً مضبوط تجزیہ کے ساتھ مضبوط قسموں کا انتخاب
- خود ساختہ ٹائم سائیکل ایڈجسٹمنٹ میکانزم
- خطرے سے نمٹنے کے لئے ایک مضبوط نظام
- ذہین دوبارہ داخلہ کا نظام
- ریئل ٹائم ٹرانزیکشن اسٹیٹس کی نمائش
اسٹریٹجک رسک
- ہلچل مچانے والی مارکیٹیں بار بار تجارت کا سبب بن سکتی ہیں
- ایک سے زیادہ اشارے پر انحصار سگنل میں تاخیر کا سبب بن سکتا ہے
- RSI کی مقررہ حد تمام مارکیٹ کے حالات کے لیے موزوں نہیں ہو سکتی
- رشتہ دار طاقت کا حساب کتاب بیس انڈیکس کی درستگی پر منحصر ہے
- 52 ہفتوں کی اونچائی پر اسٹاپ نقصان بہت زیادہ نرمی کا شکار ہوسکتا ہے
حکمت عملی کی اصلاح کی سمت
- RSI کے لیے ایڈجسٹڈ تھریڈ متعارف کروائیں
- دوبارہ داخلے کے حالات کو بہتر بنانے کے لئے عدالتی منطق
- ٹرانزیکشن حجم تجزیہ کے طول و عرض میں اضافہ
- سٹاپ پرافٹ اور سٹاپ لاس کے طریقہ کار کو بہتر بنائیں
- فلٹر میں شامل کریں
- رشتہ دار شدت کے حساب کتاب کے سائیکل کو بہتر بنائیں
خلاصہ کریں۔
اس حکمت عملی میں تکنیکی تجزیہ اور نسبتا intensity شدت کے تجزیہ کو ملا کر ایک جامع تجارتی نظام بنایا گیا ہے۔ اس کے متعدد سگنل کی تصدیق کے میکانزم اور خطرے سے نمٹنے کے نظام نے اسے ایک مضبوط عملی بنا دیا ہے۔ تجویز کردہ اصلاح کی سمت کے ذریعہ ، اس حکمت عملی میں مزید بہتری کی گنجائش ہے۔ اس حکمت عملی کے کامیاب نفاذ کے لئے تاجروں کو مارکیٹ کی گہری تفہیم کی ضرورت ہوتی ہے اور مخصوص تجارتی اقسام کی خصوصیات کے مطابق مناسب پیرامیٹرز کو ایڈجسٹ کیا جاتا ہے۔
/*backtest
start: 2019-12-23 08:00:00
end: 2024-12-03 00:00:00
period: 1d
basePeriod: 1d
exchanges: [{"eid":"Futures_Binance","currency":"BTC_USDT"}]
*/

//@version=5
strategy("EMA 13 & 21 Entry Exit", overlay=true)

// Define the EMAs
ema13 = ta.ema(close, 13)
ema21 = ta.ema(close, 21)

// Define the RSI
rsi = ta.rsi(close, 14)

// Calculate the closing price relative to Nifty 50
//nifty50 = request.security("NSE:NIFTY", timeframe.period, close)
//closeRelative = close / nifty50

// Define a base period (e.g., 123) and adjust it based on the timeframe
//basePeriod = 123

// Calculate the effective period based on the timeframe
//effectivePeriod = basePeriod * (timeframe.isintraday ? (60 / timeframe.multiplier) : 1)

// Calculate the EMA
//rs = ta.ema(closeRelative, effectivePeriod)

// Define the Relative Strength with respect to NIFTY 50
nifty50 = request.security("swap", "D", close)
rs = ta.ema(close / nifty50, 55 )

// Define the previous 2-week low and last week's high
twoWeekLow = ta.lowest(low, 10)  // 10 trading days roughly equal to 2 weeks
lastWeekHigh = ta.highest(high, 5)  // 5 trading days roughly equal to 1 week
fiftytwoWeekhigh = ta.highest(high, 52*5) // 252 tradingdays roughly equal to 52 week.

// Long condition: EMA 21 crossing above EMA 55, price above EMA 21, RSI > 50, and RS > 0
longCondition = ta.crossover(ema13, ema21) or close > ema13 and rsi > 60 and rs > 0

// Exit condition: Price closing below EMA 55 or below the previous 2-week low
exitCondition = close < ema21 or rsi < 50 or rs < 0 //or close < fiftytwoWeekhigh*0.80

// Re-entry condition: Price crossing above EMA 21 after an exit, EMA 21 > EMA 55, and RS > 1
reEntryCondition = ta.crossover(close, ema13) and ema13 > ema21 and rs > 0

// Re-entry condition if trailing stop loss is hit: Price crossing above last week's high
reEntryAfterSL = ta.crossover(close, lastWeekHigh)

// Plot the EMAs
plot(ema13 ,color=color.green, title="EMA 13",linewidth = 2)
plot(ema21, color=color.red, title="EMA 21",linewidth = 2)


// Plot buy and sell signals
plotshape(series=longCondition, location=location.abovebar, color=color.rgb(50, 243, 130), style=shape.flag, title="Buy Signal")
plotshape(series=exitCondition, location=location.belowbar, color=color.red, style=shape.xcross, title="Sell Signal")
plotshape(series=reEntryCondition or reEntryAfterSL, location=location.belowbar, color=color.blue, style=shape.labelup, title="Re-entry Signal")
//plotshape(series = fiftytwoWeekhigh,location=location.abovebar, color=color.blue,style=shape.flag, title="52WH")

// Plot background color for RS > 0
//bgcolor(rs > 0 ? color.new(color.green, 90) : na, title="RS Positive Background")
// Plot the previous 2-week low and last week's high
// plot(twoWeekLow, color=color.orange, title="2-Week Low")
// plot(lastWeekHigh, color=color.purple, title="Last Week High")

// Strategy logic
if (longCondition or reEntryCondition or reEntryAfterSL)
    strategy.entry("Long", strategy.long)

if (exitCondition)
    strategy.close("Long")

 // Calculate Stop Loss (SL) and Profit
var float entryPrice = na
var float stopLoss = na
var float profit = na

if (strategy.opentrades > 0)
    entryPrice := strategy.opentrades.entry_price(strategy.opentrades - 1)
    stopLoss := fiftytwoWeekhigh * 0.80
    profit := (close - entryPrice) / entryPrice * 100

// Display the strategy table
var table strategyTable = table.new(position.top_right, 4, 2, border_width = 1)

// Make the table movable
tableX = input.int(0, title="Table X Position")
tableY = input.int(0, title="Table Y Position")

// Add size options for the table
tableSize = input.string("small", title="Table Size", options=["tiny", "small", "large"])

// Adjust table size based on user input
tableWidth = tableSize == "tiny" ? 2 : tableSize == "small" ? 4 : 6
tableHeight = tableSize == "tiny" ? 1 : tableSize == "small" ? 2 : 3

// Create the table with the specified size
//table = table.new(position.top_right, tableWidth, tableHeight, border_width = 1)

// Position the table based on user input
// table.cell(strategyTable, tableX, tableY, "Entry Price",  bgcolor=#18eef9)
// table.cell(strategyTable, tableX, tableY + 1, str.tostring(entryPrice, format.mintick), bgcolor=#18eef9)
// table.cell(strategyTable, tableX + 1, tableY, "Stop Loss (20%)", bgcolor=color.red)
// table.cell(strategyTable, tableX + 1, tableY + 1, str.tostring(stopLoss, format.mintick), bgcolor=color.red)
// table.cell(strategyTable, tableX + 2, tableY, "Profit (%)", bgcolor=color.green)
// table.cell(strategyTable, tableX + 2, tableY + 1, str.tostring(profit, format.percent), bgcolor=color.green)