متحرک چینل اور متحرک اوسط تجارتی نظام کے ساتھ مل کر حکمت عملی کے بعد ملٹی انڈیکیٹر کا رجحان

جائزہ
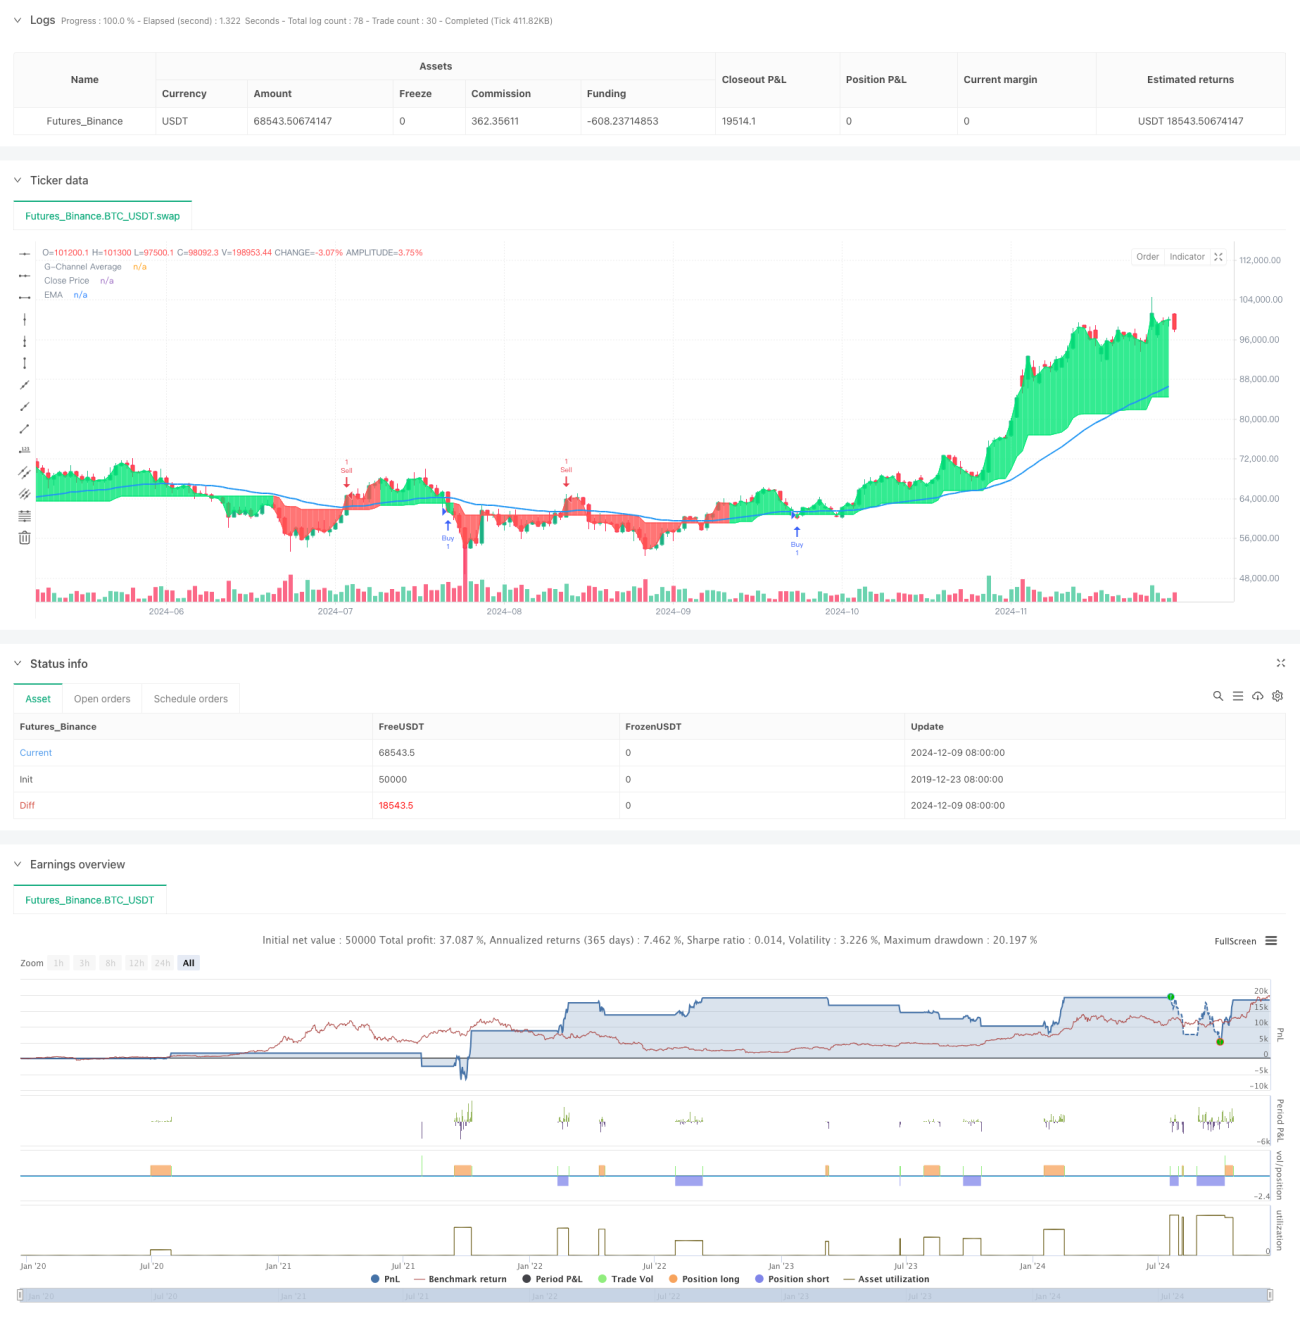
یہ حکمت عملی ایک کثیر اشارے ٹریڈنگ سسٹم ہے جس میں جی چینل ، انڈیکس منتقل اوسط ، ای ایم اے ، اور حقیقی اتار چڑھاؤ کی حد ، اے ٹی آر شامل ہے۔ یہ متحرک حمایت / مزاحمت کی سطح اور رجحان کی تصدیق کے ذریعہ تجارتی سگنل کی شناخت کرتا ہے ، اور اے ٹی آر پر مبنی اسٹاپ اور اسٹاپ کا استعمال کرتے ہوئے خطرے کا انتظام کرتا ہے۔ نظام کو قابل اعتماد اور خطرے پر قابو پانے پر توجہ دینے کے لئے ڈیزائن کیا گیا ہے ، جو تاجروں کے لئے موزوں ہے جو مستحکم تجارتی طریقہ تلاش کرتے ہیں۔
حکمت عملی کا اصول
اس حکمت عملی کی بنیادی منطق مندرجہ ذیل اہم اجزاء پر مبنی ہے:
- G چینل متحرک سپورٹ اور مزاحمت کی سطح کا حساب لگاتا ہے ، جو ریاضی کے فارمولے کے ذریعہ ٹریک پر اور نیچے مستقل طور پر ایڈجسٹ ہوتا ہے
- ای ایم اے کا استعمال مجموعی طور پر رجحان کی سمت کی تصدیق کرنے کے لئے کیا جاتا ہے ، اور ای ایم اے کے مقابلے میں قیمت کی پوزیشن تجارت کی سمت کا تعین کرتی ہے
- انٹری سگنل کی بنیاد پر G چینل کی خرابی اور EMA کی پوزیشن کی تصدیق
- اے ٹی آر کا استعمال کرتے ہوئے ضربی سیٹ سٹاپ اور سٹاپ، سٹاپ نقصان 2 گنا اے ٹی آر، سٹاپ 4 گنا اے ٹی آر
- اسٹیٹس ٹریکنگ کے ذریعے مسلسل بار بار آنے والے سگنل سے بچیں
اسٹریٹجک فوائد
- کثیر سطح کے سگنل کی توثیق کے طریقہ کار نے ٹرانزیکشن کی وشوسنییتا میں اضافہ کیا
- متحرک طور پر ایڈجسٹ شدہ چینل کی حدود مختلف مارکیٹ کے حالات کے مطابق
- فلوٹیشن پر مبنی رسک مینجمنٹ زیادہ لچکدار ہے
- بار بار چلنے والے سگنل سے بچنے سے زیادہ تجارت کا خطرہ کم ہوتا ہے
- واضح بصری خرید و فروخت کے نشانات تجزیہ اور پیمائش میں مدد کرتے ہیں
اسٹریٹجک رسک
- کراس ڈسک مارکیٹ میں ممکنہ طور پر بہت زیادہ جھوٹے بریک سگنل
- ای ایم اے کے پیچھے رہ جانے والے اشارے کے طور پر داخلے کے وقت میں تاخیر کا سبب بن سکتا ہے
- فکسڈ ضرب کے ساتھ اے ٹی آر اسٹاپ نقصانات اعلی اتار چڑھاؤ کے دوران لچکدار نہیں ہوسکتے ہیں
- طویل تاریخ کے اعداد و شمار کی ضرورت ہوتی ہے
- پیرامیٹر کی اصلاح اوور فٹنگ کا باعث بن سکتی ہے۔
حکمت عملی کی اصلاح کی سمت
- ٹرانزٹ کی تصدیق کے اشارے متعارف کروائے گئے ، جس سے کامیابی کی وشوسنییتا میں اضافہ ہوا
- متحرک طور پر اے ٹی آر کے ضارب کو مختلف مارکیٹ کے اتار چڑھاؤ کے حالات کے مطابق ڈھالنا
- مارکیٹ کے ماحول کے فلٹرز کو شامل کریں تاکہ غیر منصفانہ حالات میں تجارت سے گریز کیا جاسکے
- سگنل فلٹرنگ منطق کو بہتر بنانا ، جعلی سگنل کو مزید کم کرنا
- متحرک پوزیشن مینجمنٹ سسٹم کو شامل کرنے پر غور کریں
خلاصہ کریں۔
اس حکمت عملی نے متعدد پختہ تکنیکی اشارے کو جوڑ کر ایک مکمل تجارتی نظام تشکیل دیا ہے۔ نظام کی طاقت اس کے کثیر سطحی سگنل کی تصدیق کے طریقہ کار اور اتار چڑھاؤ پر مبنی رسک مینجمنٹ میں ہے ، لیکن پھر بھی اسے عملی استعمال میں مارکیٹ کی مخصوص خصوصیات کے مطابق بہتر بنانے کی ضرورت ہے۔ تجویز کردہ اصلاح کی سمت سے حکمت عملی کی استحکام اور موافقت کو مزید بڑھایا جاسکتا ہے۔
- 1