میان ریورژن بولنگر بینڈ ڈالر لاگت کی اوسط حکمت عملی

BB DCA EMA SMA
تخلیق کی تاریخ: 2024-12-12 17:17:15 آخر میں ترمیم کریں: 2024-12-12 17:17:15
کاپی: 2 کلکس کی تعداد: 447
1
پر توجہ دیں
1617
پیروکار

میان ریورژن بولنگر بینڈ ڈالر لاگت کی اوسط حکمت عملی

جائزہ

یہ حکمت عملی ایک ذہین سرمایہ کاری کی حکمت عملی ہے جو ڈالر کی لاگت کی اوسط (ڈی سی اے) اور بلین بینڈ تکنیکی اشارے کو جوڑتی ہے۔ یہ قیمتوں میں ردوبدل کے دوران منظم طور پر ذخیرہ اندوزی کرکے ، اوسطا واپسی کے اصول کا استعمال کرتے ہوئے سرمایہ کاری کرتی ہے۔ اس حکمت عملی کا بنیادی حصہ یہ ہے کہ قیمتوں میں بلین بینڈ سے نیچے آنے پر فکسڈ رقم کی خریداری کی کارروائی کی جائے ، جس سے مارکیٹ میں ایڈجسٹمنٹ کی مدت میں بہتر داخلے کی قیمت حاصل ہو۔

حکمت عملی کا اصول

حکمت عملی کے بنیادی اصول تین بنیادوں پر مبنی ہیں: 1) ڈالر کی اوسط لاگت ، جو باقاعدگی سے مقررہ رقم کی سرمایہ کاری کے ذریعہ وقت کا خطرہ کم کرتی ہے۔ 2) اوسط واپسی کا نظریہ ، جس کا خیال ہے کہ قیمت بالآخر اس کی تاریخی اوسط سطح پر واپس آجائے گی۔ 3) بلین بینڈ اشارے ، جو اوورلوڈ اوور سیل علاقوں کی نشاندہی کرنے کے لئے استعمال کیا جاتا ہے۔ جب قیمت بلین بینڈ سے ٹکرا جاتی ہے تو خریدنے کا اشارہ ہوتا ہے ، خریدنے کی رقم اس کی مقررہ سرمایہ کاری سے تقسیم کی جاتی ہے جو موجودہ قیمت پر منحصر ہوتی ہے۔ حکمت عملی میں بلین بینڈ کے راستے کے طور پر 200 سیکنڈ انڈیکس کی اوسط اوسط لائن کا استعمال کیا جاتا ہے ، جس میں معیاری فاصلے کی تعداد 2 ہے ، اس طرح اوپر اور نیچے کی تعریف کی جاتی ہے۔

اسٹریٹجک فوائد

  1. انتخاب کے وقت خطرہ کم کریں - ذاتی فیصلے کے بجائے منظم خریداری کے ذریعہ انسانی غلطی کو کم کریں
  2. واپسی کے مواقع سے فائدہ اٹھائیں - قیمتوں میں اضافے کے دوران خود بخود خریدنے کا عمل
  3. لچکدار پیرامیٹرز کی ترتیب - مختلف مارکیٹ کے حالات کے مطابق بلین بینڈ پیرامیٹرز اور سرمایہ کاری کی رقم کو ایڈجسٹ کریں
  4. واضح انٹری اور آؤٹ ریگولیشن - تکنیکی اشارے پر مبنی معروضی اشارے
  5. خود کار طریقے سے عملدرآمد - بغیر کسی انسانی مداخلت کے ، جذباتی تجارت سے بچنے کے لئے

اسٹریٹجک رسک

  1. اوسط واپسی کے خاتمے کا خطرہ - رجحان مارکیٹ میں زیادہ جھوٹے سگنل پیدا ہوسکتے ہیں
  2. فنڈ مینجمنٹ کا خطرہ - مسلسل خریدنے کے اشاروں کے لئے کافی فنڈز مختص کرنے کی ضرورت
  3. پیرامیٹرز کو بہتر بنانے کا خطرہ - ضرورت سے زیادہ اصلاح سے حکمت عملی ناکام ہوسکتی ہے
  4. مارکیٹ کے ماحول پر انحصار - شدید اتار چڑھاؤ والی مارکیٹوں میں خراب کارکردگی کا امکان ان خطرات کا انتظام کرنے کے لئے سخت فنڈ مینجمنٹ سسٹم اور حکمت عملی کی کارکردگی کا باقاعدگی سے جائزہ لینے کی سفارش کی جاتی ہے۔

حکمت عملی کی اصلاح کی سمت

  1. رجحان فلٹر متعارف کروائیں تاکہ مضبوط رجحانات میں الٹا آپریشن سے بچا جاسکے
  2. ایک سے زیادہ ٹائم سائیکل کی توثیق کا طریقہ کار شامل کرنا
  3. فنڈ مینجمنٹ سسٹم کو بہتر بنانا ، سرمایہ کاری کی رقم کو اتار چڑھاؤ کی شرح کے مطابق ڈائنامک ایڈجسٹ کرنا
  4. منافع بند کرنے کا طریقہ کار شامل کریں ، قیمتوں میں واپسی کی اوسط قیمت پر منافع بند کریں
  5. دیگر تکنیکی اشارے کے ساتھ مل کر سگنل کی وشوسنییتا کو بہتر بنانے پر غور کریں

خلاصہ کریں۔

یہ ایک مستحکم حکمت عملی ہے جو تکنیکی تجزیہ کو منظم سرمایہ کاری کے طریقوں کے ساتھ جوڑتی ہے۔ برلن کے ذریعہ اوورلوڈ مواقع کی نشاندہی کرنا ، ڈالر کی لاگت کی اوسط کے ساتھ مل کر خطرے کو کم کرنا ہے۔ حکمت عملی کی کامیابی کی کلید پیرامیٹرز کی معقول ترتیب اور سخت نفاذ کے نظم و ضبط میں ہے۔ اگرچہ کچھ خطرہ موجود ہے ، لیکن اس حکمت عملی کی استحکام کو مسلسل اصلاح اور خطرے کے انتظام سے بڑھایا جاسکتا ہے۔
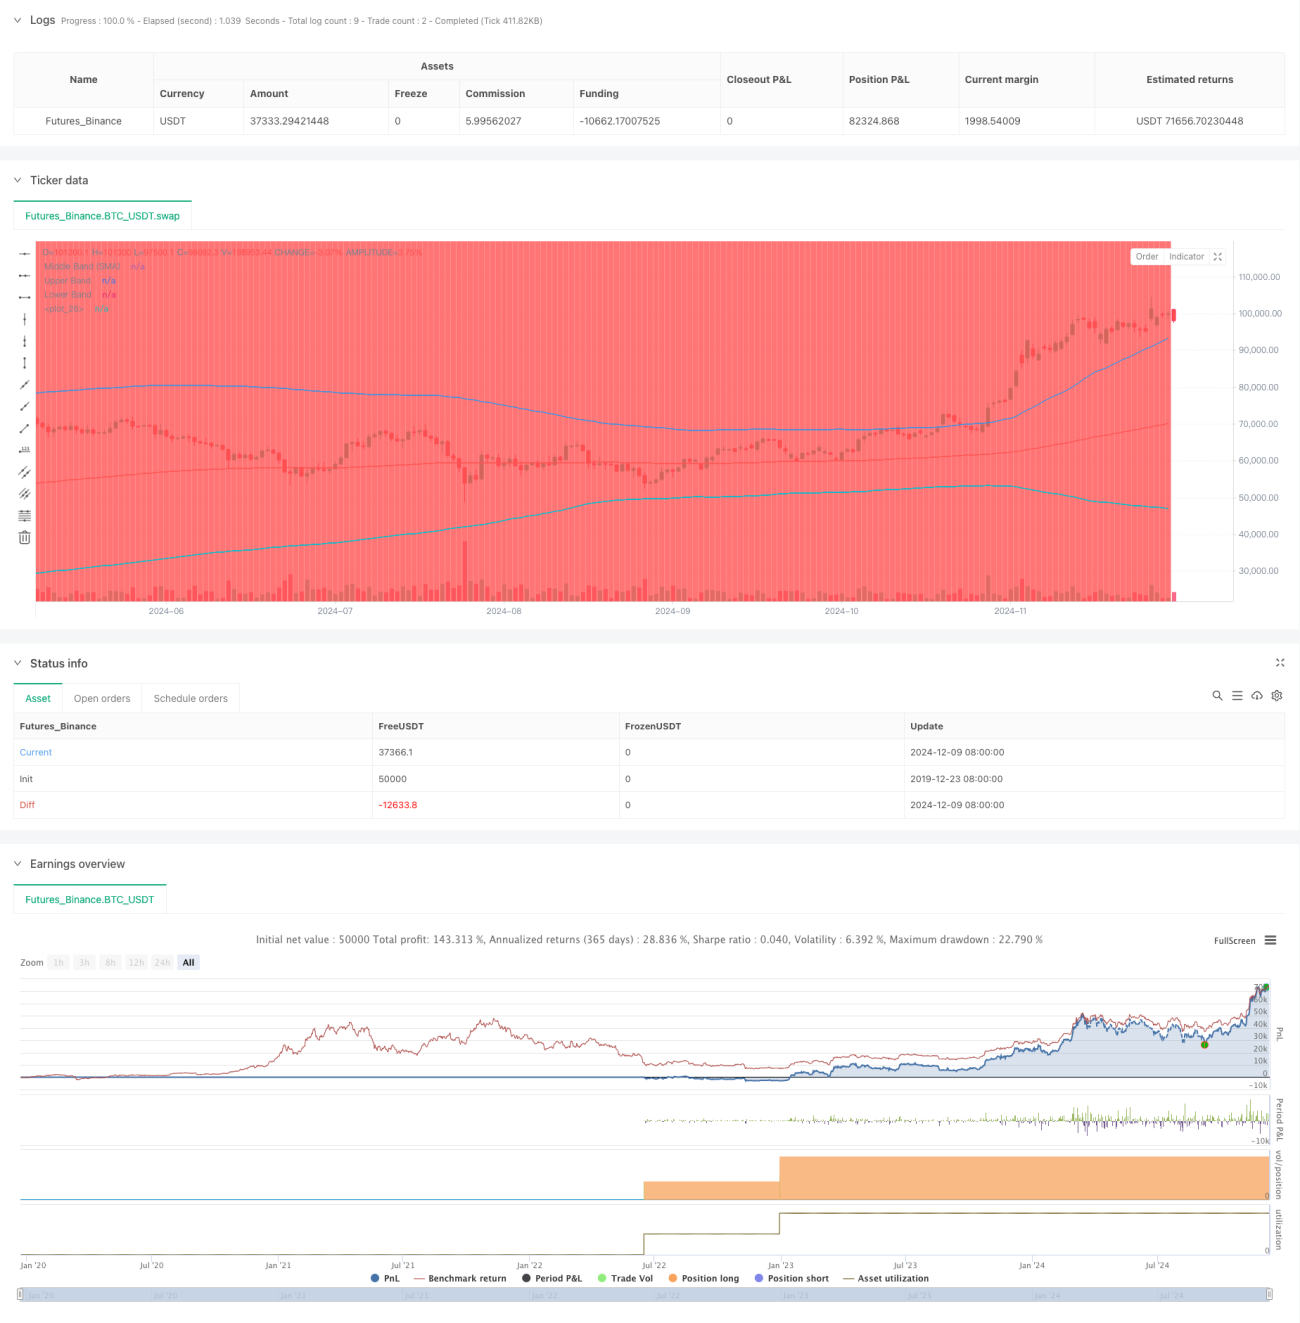
حکمت عملی کا ماخذ کوڈ
/*backtest
start: 2019-12-23 08:00:00
end: 2024-12-10 08:00:00
period: 1d
basePeriod: 1d
exchanges: [{"eid":"Futures_Binance","currency":"BTC_USDT"}]
*/

//@version=5
strategy("DCA Strategy with Mean Reversion and Bollinger Band", overlay=true) // Define the strategy name and set overlay=true to display on the main chart

// Inputs for investment amount and dates
investment_amount = input.float(10000, title="Investment Amount (USD)", tooltip="Amount to be invested in each buy order (in USD)") // Amount to invest in each buy order
open_date = input(timestamp("2024-01-01 00:00:00"), title="Open All Positions On", tooltip="Date when to start opening positions for DCA strategy") // Date to start opening positions
close_date = input(timestamp("2024-08-04 00:00:00"), title="Close All Positions On", tooltip="Date when to close all open positions for DCA strategy") // Date to close all positions

// Bollinger Band parameters
source = input.source(title="Source", defval=close, group="Bollinger Band Parameter", tooltip="The price source to calculate the Bollinger Bands (e.g., closing price)") // Source of price for calculating Bollinger Bands (e.g., closing price)
length = input.int(200, minval=1, title='Period', group="Bollinger Band Parameter", tooltip="Period for the Bollinger Band calculation (e.g., 200-period moving average)") // Period for calculating the Bollinger Bands (e.g., 200-period moving average)
mult = input.float(2, minval=0.1, maxval=50, step=0.1, title='Standard Deviation', group="Bollinger Band Parameter", tooltip="Multiplier for the standard deviation to define the upper and lower bands") // Multiplier for the standard deviation to calculate the upper and lower bands

// Timeframe selection for Bollinger Bands
tf = input.timeframe(title="Bollinger Band Timeframe", defval="240", group="Bollinger Band Parameter", tooltip="The timeframe used to calculate the Bollinger Bands (e.g., 4-hour chart)") // Timeframe for calculating the Bollinger Bands (e.g., 4-hour chart)

// Calculate BB for the chosen timeframe using security
[basis, bb_dev] = request.security(syminfo.tickerid, tf, [ta.ema(source, length), mult * ta.stdev(source, length)]) // Calculate Basis (EMA) and standard deviation for the chosen timeframe
upper = basis + bb_dev // Calculate the Upper Band by adding the standard deviation to the Basis
lower = basis - bb_dev // Calculate the Lower Band by subtracting the standard deviation from the Basis

// Plot Bollinger Bands
plot(basis, color=color.red, title="Middle Band (SMA)") // Plot the middle band (Basis, EMA) in red
plot(upper, color=color.blue, title="Upper Band") // Plot the Upper Band in blue
plot(lower, color=color.blue, title="Lower Band") // Plot the Lower Band in blue
fill(plot(upper), plot(lower), color=color.blue, transp=90) // Fill the area between Upper and Lower Bands with blue color at 90% transparency

// Define buy condition based on Bollinger Band 
buy_condition = ta.crossunder(source, lower) // Define the buy condition when the price crosses under the Lower Band (Mean Reversion strategy)

// Execute buy orders on the Bollinger Band Mean Reversion condition
if (buy_condition ) // Check if the buy condition is true and time is within the open and close date range
    strategy.order("DCA Buy", strategy.long, qty=investment_amount / close) // Execute the buy order with the specified investment amount

// Close all positions on the specified date
if (time >= close_date) // Check if the current time is after the close date
    strategy.close_all() // Close all open positions

// Track the background color state
var color bgColor = na // Initialize a variable to store the background color (set to 'na' initially)

// Update background color based on conditions
if close > upper // If the close price is above the Upper Band
    bgColor := color.red // Set the background color to red
else if close < lower // If the close price is below the Lower Band
    bgColor := color.green // Set the background color to green

// Apply the background color
bgcolor(bgColor, transp=90, title="Background Color Based on Bollinger Bands") // Set the background color based on the determined condition with 90% transparency

// Postscript:
// 1. Once you have set the "Investment Amount (USD)" in the input box, proceed with additional configuration. 
// Go to "Properties" and adjust the "Initial Capital" value by calculating it as "Total Closed Trades" multiplied by "Investment Amount (USD)" 
// to ensure the backtest results are aligned correctly with the actual investment values.
//
// Example:
// Investment Amount (USD) = 100 USD
// Total Closed Trades = 10 
// Initial Capital = 10 x 100 = 1,000 USD

// Investment Amount (USD) = 200 USD
// Total Closed Trades = 24 
// Initial Capital = 24 x 200 = 4,800 USD