متعدد توازن قیمت کے رجحان کی پیروی اور الٹ ٹریڈنگ حکمت عملی

ATR SL TP
تخلیق کی تاریخ: 2024-12-13 10:23:12 آخر میں ترمیم کریں: 2024-12-13 10:23:12
کاپی: 0 کلکس کی تعداد: 364
1
پر توجہ دیں
1617
پیروکار

متعدد توازن قیمت کے رجحان کی پیروی اور الٹ ٹریڈنگ حکمت عملی

حکمت عملی کا جائزہ

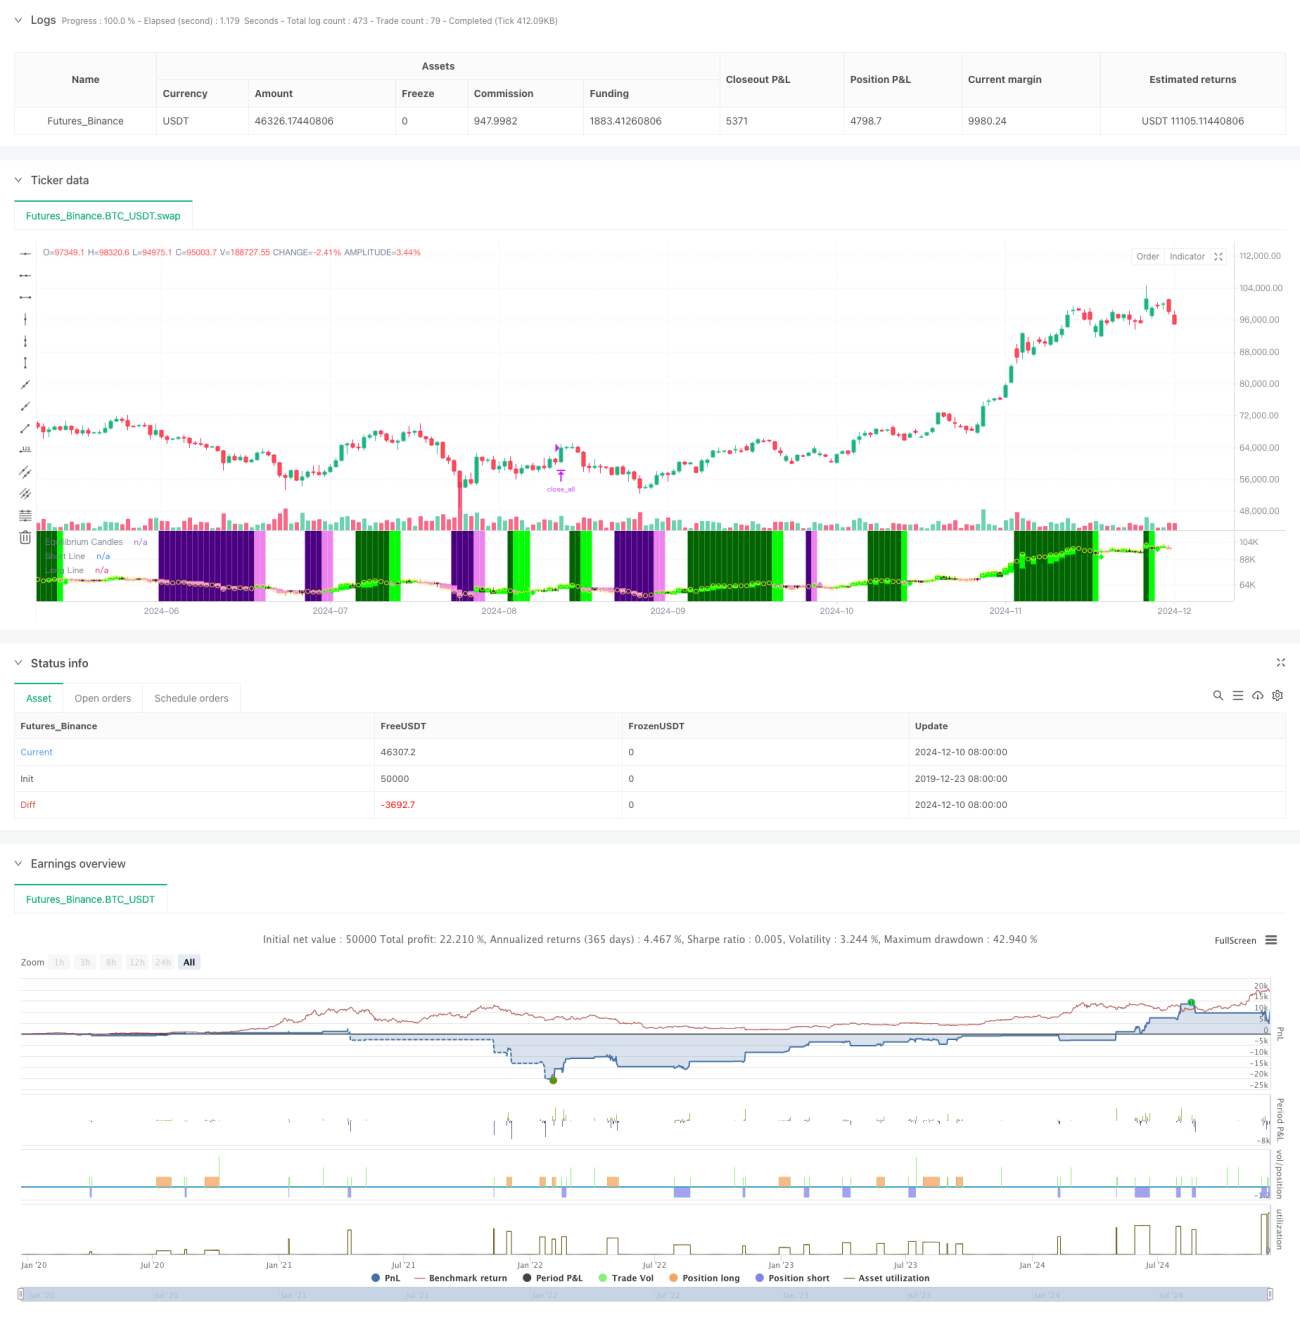
یہ حکمت عملی قیمت کے توازن پوائنٹس پر مبنی رجحان کی پیروی اور الٹ ٹریڈنگ سسٹم ہے۔ یہ پچھلے X روٹ K لائن کی اعلی ترین اور کم سے کم پوائنٹس کی درمیانی قیمتوں کا حساب کتاب کرکے توازن کی قیمت کا تعین کرتا ہے ، اور توازن کی قیمت کے مقابلے میں اختتامی قیمت کی پوزیشن پر مبنی رجحان کی سمت کا فیصلہ کرتا ہے۔ جب قیمت مسلسل توازن کی قیمت کی طرف سے K لائنوں کی مقررہ تعداد تک پہنچ جاتی ہے تو ، نظام رجحان کی شناخت کرتا ہے۔ پہلی بار الٹ ہونے پر قائم کیا گیا ((قیمتوں میں توازن کی قیمتوں کو توڑنا)) سسٹم داخلے کے مواقع کی تلاش کرتا ہے۔ یہ حکمت عملی رجحان کی پیروی یا الٹ ٹریڈنگ کے انداز کو منتخب کرنے کے لئے ترتیب دی جاسکتی ہے۔

حکمت عملی کا اصول

  1. مساوات کی قیمت کا حساب کتاب: ماضی X جڑ K لائن کی اعلی ترین قیمت اور کم سے کم قیمت کے وسط نقطہ کو مساوات کی قیمت کے طور پر استعمال کیا جاتا ہے ، جو پہلی بار مساوات کے چارٹ کی بنیاد پر بیس لائن کے حساب کتاب کے طریقہ کار کے برابر ہے۔
  2. رجحان کا فیصلہ: جب قیمت متوازن قیمت کے اسی طرف X روٹ K لائن کو مسلسل برقرار رکھتی ہے (ڈیفالٹ 7 روٹ) ، تو اس کا فیصلہ کیا جاتا ہے کہ یہ رجحان قائم ہے۔
  3. انٹری سگنل: رجحان کے قیام کے بعد پہلی ریڈارٹ ((قیمت نے مساوات کی قیمت کو توڑ دیا) پر انٹری سگنل کو متحرک کریں۔
  4. سٹاپ نقصان: اے ٹی آر کے 60٪ پوائنٹس کا استعمال کرتے ہوئے متحرک طور پر سٹاپ نقصان کی فاصلے کو ایڈجسٹ کرنے کے لئے، خطرے کے کنٹرول میں لچک فراہم کرتا ہے.
  5. بڑے پیمانے پر اتار چڑھاؤ سے بچاؤ: جب قیمتوں میں استحکام کی سطح سے زیادہ قیمتوں کی قیمتوں میں اضافہ ہوتا ہے تو ، نظام خود بخود اس کی جگہ لے لیتا ہے تاکہ بڑے پیمانے پر واپسی کو روک سکے۔

اسٹریٹجک فوائد

  1. لچکدار: مارکیٹ کی خصوصیات کے مطابق رجحانات کی پیروی کرنے اور تجارت کے موڈ کو تبدیل کرنے میں لچکدار۔
  2. خطرہ کنٹرول میں بہتری: متحرک اے ٹی آر نقصانات کو روکنے اور بڑے پیمانے پر اتار چڑھاؤ کے تحفظ کے طریقہ کار کے ساتھ۔
  3. آپریشنل وضاحت: ٹریڈنگ سگنل واضح ہیں ، پیچیدہ تکنیکی اشارے کے مجموعے پر انحصار نہیں کرتے ہیں۔
  4. اچھے بصری اثرات: رنگین K لائن اور پس منظر کا استعمال کرتے ہوئے مارکیٹ کی حالت کا ایک بدیہی ڈسپلے فراہم کرتا ہے۔
  5. آٹومیشن دوستانہ: MT5 جیسے ٹریڈنگ پلیٹ فارم کو آسانی سے جوڑ کر خودکار تجارت کی جاسکتی ہے۔

اسٹریٹجک رسک

  1. زلزلے کا خطرہ: زلزلے کے بازار میں اکثر غلط سگنل پیدا ہوسکتے ہیں۔
  2. سلائڈ پوائنٹ اثر: شدید اتار چڑھاو کے دوران زیادہ سلائڈ کا سامنا کرنا پڑ سکتا ہے۔
  3. پیرامیٹرز کی حساسیت: بنیادی پیرامیٹرز جیسے توازن کی مدت ، رجحان کا فیصلہ کرنے کا دورانیہ وغیرہ کو مختلف مارکیٹوں کے لئے احتیاط سے بہتر بنانے کی ضرورت ہے۔
  4. مارکیٹ سوئچنگ کا خطرہ: مارکیٹ میں رجحان سے ہلچل کی منتقلی کے دوران بڑے پیمانے پر واپسی کا سبب بن سکتا ہے۔

حکمت عملی کی اصلاح کی سمت

  1. مارکیٹ کے ماحول کی شناخت: مارکیٹ کے ماحول کے فیصلے کے ماڈیول کو شامل کریں ، مختلف مارکیٹ کے حالات میں حکمت عملی کے پیرامیٹرز کو متحرک طور پر ایڈجسٹ کریں۔
  2. سگنل فلٹرنگ: جعلی سگنل کو فلٹر کرنے کے لئے ٹریفک ، اتار چڑھاؤ کی شرح اور دیگر معاون اشارے شامل کرنے پر غور کریں۔
  3. پوزیشن مینجمنٹ: پوزیشن مینجمنٹ کے زیادہ پیچیدہ میکانزم متعارف کروائے ، جیسے اتار چڑھاؤ پر مبنی متحرک ایڈجسٹمنٹ۔
  4. ایک سے زیادہ ٹائم پیکیج: تجارت کی درستگی کو بہتر بنانے کے لئے ایک سے زیادہ ٹائم پیکیج سگنل کو ضم کرنا۔
  5. ٹرانزیکشن لاگت کو بہتر بنانا: مختلف ٹرانزیکشن اقسام کے لئے لاگت کی خصوصیات کو بہتر بنانا۔

خلاصہ کریں۔

یہ ایک معقول ڈیزائن شدہ ٹرینڈ ٹریڈنگ سسٹم ہے جو قیمتوں کو متوازن کرنے کے اس بنیادی تصور کے ذریعے واضح ٹریڈنگ منطق فراہم کرتا ہے۔ اس حکمت عملی کی سب سے بڑی خصوصیت یہ ہے کہ یہ لچکدار ہے ، جو رجحانات کی پیروی کرنے کے لئے استعمال کیا جاسکتا ہے اور واپسی کی تجارت کے لئے بھی استعمال کیا جاسکتا ہے ، اور اس کے ساتھ ساتھ ایک مکمل رسک کنٹرول میکانزم ہے۔ اگرچہ مارکیٹ کے کچھ حالات میں چیلنج ہوسکتا ہے ، لیکن مسلسل اصلاح اور لچکدار ایڈجسٹمنٹ کے ذریعہ ، اس حکمت عملی کو مارکیٹ کے مختلف ماحول میں مستحکم کارکردگی کا مظاہرہ کرنے کی امید ہے۔

حکمت عملی کا ماخذ کوڈ
/*backtest
start: 2019-12-23 08:00:00
end: 2024-12-11 08:00:00
period: 1d
basePeriod: 1d
exchanges: [{"eid":"Futures_Binance","currency":"BTC_USDT"}]
*/

// This Pine Script™ code is subject to the terms of the Mozilla Public License 2.0 at https://mozilla.org/MPL/2.0/
// © Honestcowboy

//@version=5
strategy("Equilibrium Candles + Pattern [Honestcowboy]", overlay=false)

// ================================== //
// ---------> User Input <----------- //
// ================================== //

candleSmoothing = input.int(9, title="Equilibrium Length", tooltip="The lookback for finding equilibrium.\nIt is same calculation as the Baseline in Ichimoku Cloud and is the mid point between highest and lowest value over this length.", group="Base Settings")
candlesForTrend = input.int(7, title="Candles needed for Trend", tooltip="The amount of candles in one direction (colored) before it's considered a trend.\nOrders get created on the first candle in opposite direction.", group="Base Settings")
maxPullbackCandles = input.int(2, title="Max Pullback (candles)", tooltip="The amount of candles can go in opposite direction until a pending trade order is cancelled.", group="Base Settings")
candle_bull_c1 = input.color(color.rgb(0,255,0), title="", inline="1", group="Candle Coloring")
candle_bull_c2 = input.color(color.rgb(0,100,0), title="", inline="1", group="Candle Coloring")
candle_bear_c1 = input.color(color.rgb(238,130,238), title="", inline="2", group="Candle Coloring")
candle_bear_c2 = input.color(color.rgb(75,0,130), title="", inline="2", group="Candle Coloring")
highlightClosePrices = input.bool(defval=true, title="Highlight close prices", group="Candle Coloring", tooltip="Will put small yellow dots where closing price would be.")
useBgColoring = input.bool(defval=true, title="color main chart Bg based on trend and entry point", tooltip="colors main chart background based on trend and entry points", group="Chart Background")
trend_bull_c = input.color(color.rgb(0,100,0,50), title="Trend Bull Color", group="Chart Background")
trend_bear_c = input.color(color.rgb(75,0,130, 50), title="Trend Bear Color", group="Chart Background")
long_zone_c = input.color(color.rgb(0,255,0,60), title="Long Entry Zone Color", group="Chart Background")
short_zone_c = input.color(color.rgb(238,130,238,60), title="Short Entry Zone Color", group="Chart Background")
atrLenghtScob = input.int(14, title="ATR Length", group = "Volatility Settings")
atrAverageLength = input.int(200, title="ATR percentile averages lookback", group = "Volatility Settings")
atrPercentile    = input.int(60, minval=0, maxval=99, title="ATR > bottom X percentile", group = "Volatility Settings", tooltip="For the Final ATR value in which percentile of last X bars does it need to be a number. At 60 it's the lowest ATR in top 40% of ATR over X bars")
useReverse = input.bool(true, title="Use Reverse", group="Strategy Inputs", tooltip="The Strategy will open short orders where normal strategy would open long orders. It will use the SL as TP and the TP as SL. So would create the exact opposite in returns as the normal strategy.")
stopMultiplier = input.float(2, title="stop+tp atr multiplier", group="Strategy Inputs")
useTPSL = input.bool(defval=true, title="use stop and TP", group="Strategy Inputs")
useBigCandleExit = input.bool(defval=true, title="Big Candle Exit", group="Strategy Inputs", inline="1", tooltip="Closes all open trades whenever price closes too far from the equilibrium")
bigCandleMultiplier = input.float(defval=1, title="Exit Multiplier", group="Strategy Inputs", inline="1", tooltip="The amount of times in ATR mean candle needs to close outside of equilibrium for it to be a big candle exit.")

tvToQPerc = input.float(defval=1, title="Trade size in Account risk %", group="Tradingview.to Connection (MT5)", tooltip="Quantity as a percentage with stop loss in the commands; the lot size is calculated based on the percentage to lose in case sl is hit. If SL is not specified, the Lot size will be calculated based on account balance.")
tvToOverrideSymbol = input.bool(defval=false, title="Override Symbol?", group="Tradingview.to Connection (MT5)")
tvToSymbol = input.string(defval="EURUSD", title="", group="Tradingview.to Connection (MT5)")
// ================================== //
// -----> Immutable Constants <------ //
// ================================== // 

var bool isBullTrend = false
var bool isBearTrend = false
var bool isLongCondition = false
var bool isShortCondition = false
var int bullCandleCount = 0
var int bearCandleCount = 0
var float longLine = na
var float shortLine = na

// ================================== //
// ---> Functional Declarations <---- //
// ================================== //

baseLine(len) =>
    math.avg(ta.lowest(len), ta.highest(len))

// ================================== //
// ----> Variable Calculations <----- //
// ================================== //

longSignal = false
shortSignal = false

equilibrium = baseLine(candleSmoothing)
atrEquilibrium = ta.atr(atrLenghtScob)
atrAveraged = ta.percentile_nearest_rank(atrEquilibrium, atrAverageLength, atrPercentile)
equilibriumTop  = equilibrium + atrAveraged*bigCandleMultiplier
equilibriumBottom = equilibrium - atrAveraged*bigCandleMultiplier

// ================================== //
// -----> Conditional Variables <---- //
// ================================== //
if not isBullTrend and close>equilibrium
    bullCandleCount := bullCandleCount + 1
    bearCandleCount := 0
    isBearTrend := false

if not isBearTrend and close<equilibrium
    bearCandleCount := bearCandleCount + 1
    bullCandleCount := 0
    isBullTrend := false

if bullCandleCount >= candlesForTrend
    isBullTrend := true
    isBearTrend := false
    bullCandleCount := 0
    bearCandleCount := 0
if bearCandleCount >= candlesForTrend
    isBearTrend := true
    isBullTrend := false
    bullCandleCount := 0
    bearCandleCount := 0

// ================================== //
// ------> Strategy Execution <------ //
// ================================== //

if isBullTrend[1] and close<equilibrium
    if useReverse and (not na(atrAveraged))
        strategy.entry("short", strategy.short, limit=high)
        alert("Sell " + str.tostring((tvToOverrideSymbol ? tvToSymbol : syminfo.ticker)) + " Q=" + str.tostring(tvToQPerc) + "% P=" + str.tostring(high) + " TP=" + str.tostring(high-stopMultiplier*atrAveraged)+ " SL=" + str.tostring(high+stopMultiplier*atrAveraged), freq=alert.freq_once_per_bar)
    if (not useReverse) and (not na(atrAveraged))
        strategy.entry("long", strategy.long, stop=high)
        alert("Buy " + str.tostring((tvToOverrideSymbol ? tvToSymbol : syminfo.ticker)) + " Q=" + str.tostring(tvToQPerc) + "% P=" + str.tostring(high) + " TP=" + str.tostring(high+stopMultiplier*atrAveraged) + " SL=" + str.tostring(high+stopMultiplier*atrAveraged), freq=alert.freq_once_per_bar)
    isLongCondition := true
    isBullTrend := false
    longLine := high

if isBearTrend[1] and close>equilibrium
    if useReverse and (not na(atrAveraged))
        strategy.entry("long", strategy.long, limit=low)
        alert("Buy " + str.tostring((tvToOverrideSymbol ? tvToSymbol : syminfo.ticker)) + " Q=" + str.tostring(tvToQPerc) + "% P=" + str.tostring(low) + " TP=" + str.tostring(low+stopMultiplier*atrAveraged) + " SL=" + str.tostring(low-stopMultiplier*atrAveraged), freq=alert.freq_once_per_bar)
    if (not useReverse) and (not na(atrAveraged))
        strategy.entry("short", strategy.short, stop=low)
        alert("Sell " + str.tostring((tvToOverrideSymbol ? tvToSymbol : syminfo.ticker)) + " Q=" + str.tostring(tvToQPerc) + "% P=" + str.tostring(low) + " TP=" + str.tostring(low-stopMultiplier*atrAveraged) + " SL=" + str.tostring(low+stopMultiplier*atrAveraged), freq=alert.freq_once_per_bar)
    isShortCondition := true
    isBearTrend := false
    shortLine := low

if isLongCondition and (bearCandleCount >= maxPullbackCandles)[1]
    if useReverse
        strategy.cancel("short")
        alert("Cancel " + str.tostring((tvToOverrideSymbol ? tvToSymbol : syminfo.ticker)) + " t=sell")
    if not useReverse
        strategy.cancel("long")
        alert("Cancel " + str.tostring((tvToOverrideSymbol ? tvToSymbol : syminfo.ticker)) + " t=buy")
    isLongCondition := false
    bullCandleCount := 0
    longLine := na

if isShortCondition and (bullCandleCount >= maxPullbackCandles)[1]
    if useReverse
        strategy.cancel("long")
        alert("Cancel " + str.tostring((tvToOverrideSymbol ? tvToSymbol : syminfo.ticker)) + " t=buy")
    if not useReverse
        strategy.cancel("short")
        alert("Cancel " + str.tostring((tvToOverrideSymbol ? tvToSymbol : syminfo.ticker)) + " t=sell")
    isShortCondition := false
    bearCandleCount := 0
    shortLine := na
    
// ---- Save for graphical display that there is a longcondition + reset other variables
if high>longLine
    longSignal := true
    longLine := na
    isLongCondition := false

if low<shortLine
    shortSignal := true
    shortLine := na
    isShortCondition := false
// ---- Get Stop loss and Take Profit in there
if useReverse
    if useTPSL
        if strategy.position_size < 0 and strategy.position_size[1] >= 0
            strategy.exit("short exit", "short", limit=longLine[1]-stopMultiplier*atrAveraged, stop=longLine[1]+stopMultiplier*atrAveraged)
        if strategy.position_size > 0 and strategy.position_size[1] <= 0
            strategy.exit("long exit", "long", limit=shortLine[1]+stopMultiplier*atrAveraged, stop=shortLine[1]-stopMultiplier*atrAveraged)
if not useReverse
    if useTPSL
        if strategy.position_size > 0 and strategy.position_size[1] <= 0
            strategy.exit("long exit", "long", limit=longLine[1]+stopMultiplier*atrAveraged, stop=longLine[1]-stopMultiplier*atrAveraged)
        if strategy.position_size < 0 and strategy.position_size[1] >=0
            strategy.exit("short exit", "short", limit=shortLine[1]-stopMultiplier*atrAveraged, stop=shortLine[1]+stopMultiplier*atrAveraged)
// ----- Logic for closing positions on a big candle in either direction
if (strategy.position_size[1]>0 or strategy.position_size[1]<0) and useBigCandleExit
    if close>equilibriumTop or close<equilibriumBottom
        strategy.close_all("Big Candle Stop")
        alert("close " + str.tostring((tvToOverrideSymbol ? tvToSymbol : syminfo.ticker)))

// ================================== //
// ------> Graphical Display <------- //
// ================================== //

// Deviation from equilibrium using smoothed ATR and percentile nearest rank to rank the coloring of the candles
candle_c2 = close>equilibrium ? close>open ? candle_bull_c1 : candle_bull_c2 : close<open ? candle_bear_c1 : candle_bear_c2
// 
plotcandle(equilibrium, high, low, close, title="Equilibrium Candles", color=candle_c2, wickcolor=candle_c2, bordercolor=candle_c2)
plotshape(highlightClosePrices ? close : na, title="Closing Bubble", style=shape.circle, location=location.absolute, color=color.yellow)
bgcolor(useBgColoring ? (isBullTrend ? trend_bull_c : isBearTrend ? trend_bear_c : isLongCondition ? long_zone_c : isShortCondition ? short_zone_c : na) : na, force_overlay=true)
plot(longLine, color=candle_bull_c1, title="Long Line", style=plot.style_linebr, linewidth=4)
plot(shortLine, color=candle_bear_c1, title="Short Line", style=plot.style_linebr, linewidth=4)
plotshape(longSignal ? math.min(equilibrium, low)+(-0.5*atrAveraged) : na, title="Long Signal", color=candle_bull_c1, style=shape.diamond, size=size.tiny, location=location.absolute)
plotshape(shortSignal ? math.max(equilibrium, high)+(0.5*atrAveraged) : na, title="Short Signal", color=candle_bear_c1, style=shape.diamond, size=size.tiny, location=location.absolute)

// =================================== //
// ------> Simple Form Alerts <------- //
// =================================== //

alertcondition(longSignal, "Simple Long Signal")
alertcondition(shortSignal, "Simple Short Signal")