
جائزہ
یہ حکمت عملی ایک تکنیکی تجزیہ پر مبنی رجحان ٹریکنگ سسٹم ہے ، جس میں ٹریڈنگ کے مواقع کی تصدیق کے لئے ایک سے زیادہ سگنل کی توثیق کے ذریعہ ایک اوسط نظام ، آر ایس آئی متحرک اشارے اور اے ٹی آر اتار چڑھاؤ کے اشارے شامل ہیں۔ حکمت عملی مارکیٹ کے رجحانات کا اندازہ لگانے کے لئے ایک سے زیادہ دورانیہ اوسط لائنوں کا استعمال کرتی ہے ، جبکہ آر ایس آئی متحرک قیمت کی طاقت کی تصدیق کرتی ہے ، اور آخر میں اے ٹی آر کی متحرک سیٹنگ کو روکنے اور فائدہ اٹھانے کے لئے استعمال کرتی ہے ، جس سے ایک مکمل تجارتی نظام تشکیل دیا جاتا ہے۔
حکمت عملی کا اصول
اس حکمت عملی کی بنیادی منطق تین اہم حصوں پر مشتمل ہے:
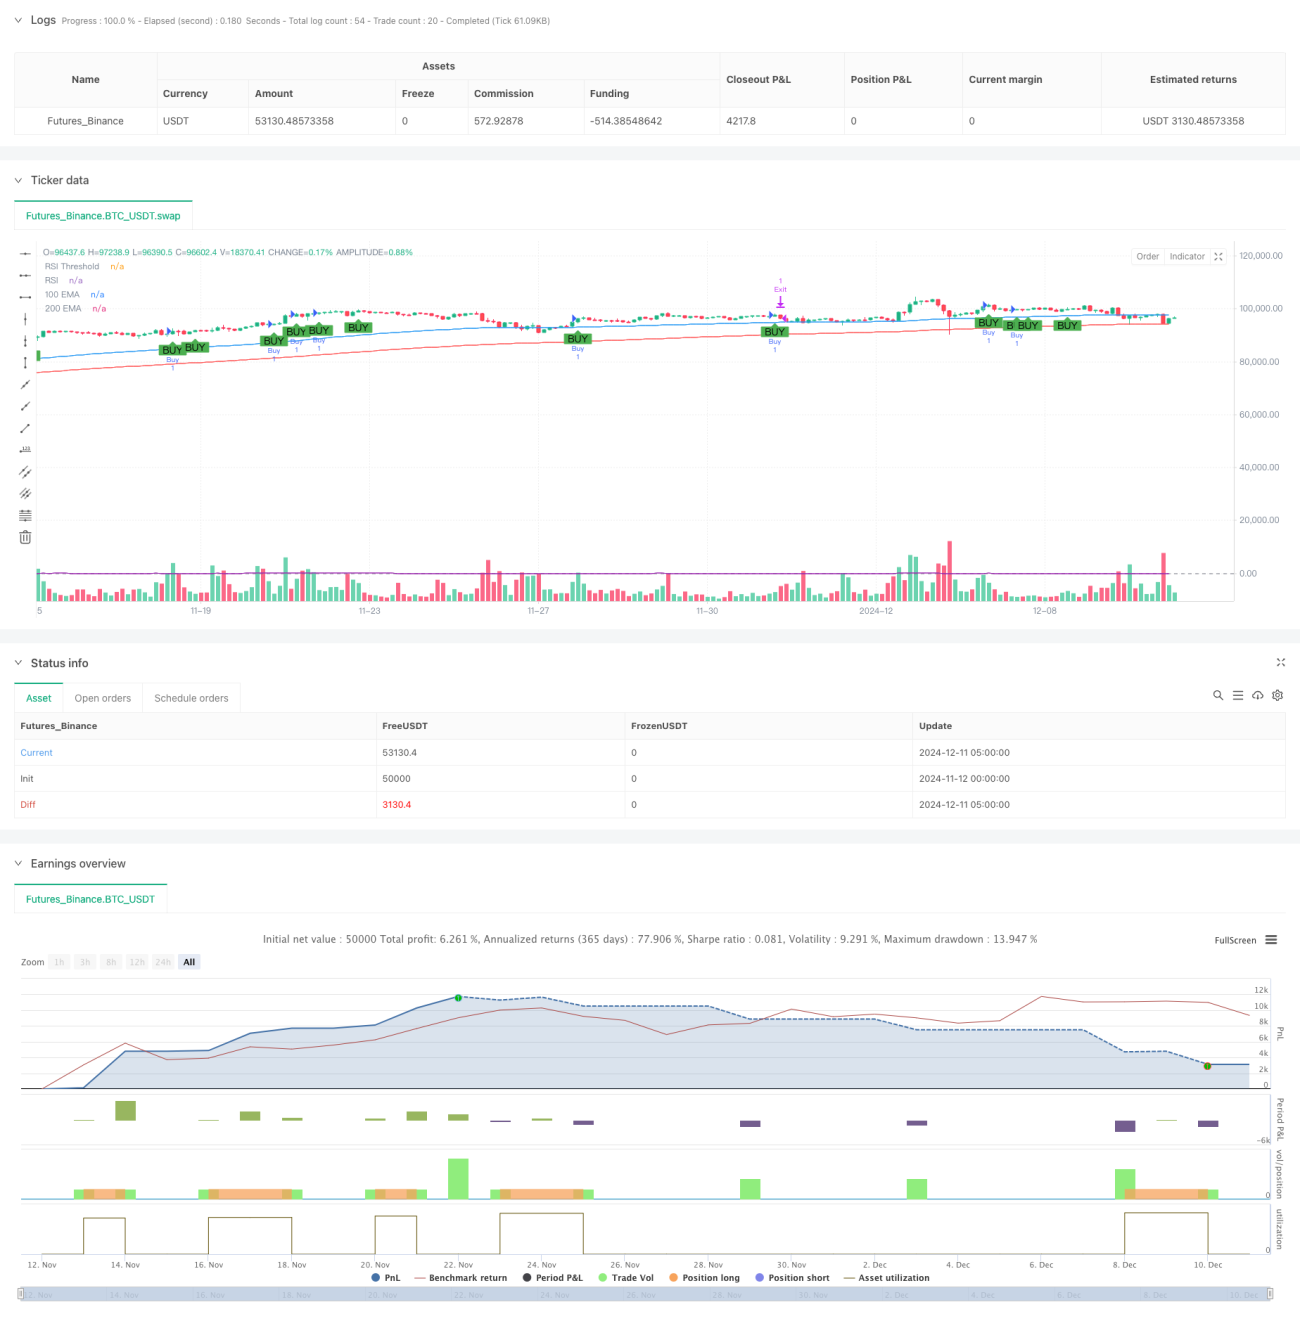
- رجحانات کا تعین: مارکیٹ میں رجحانات کی سمت کی تصدیق کرنے کے لئے 100 دوروں اور 200 دوروں کے انڈیکس چلنے والی اوسط (ای ایم اے) کا استعمال کریں۔ جب قلیل مدتی ای ایم اے طویل مدتی ای ایم اے کے اوپر ہوتا ہے تو ، اس سے ظاہر ہوتا ہے کہ مارکیٹ عروج پر ہے۔
- انٹری سگنل: رجحان کی تصدیق کی بنیاد پر ، حکمت عملی نے بیجنگ کو نگلنے والی شکل کو ایک مخصوص انٹری پوائنٹ کے طور پر تلاش کیا ، اور آر ایس آئی اشارے کا استعمال کرتے ہوئے سگنل فلٹرنگ کی۔ جب آر ایس آئی کی تعداد 50 سے زیادہ ہے تو ، اس سے ظاہر ہوتا ہے کہ مارکیٹ میں کافی اضافے کی حرکیات موجود ہیں۔
- پوزیشن مینجمنٹ: مارکیٹ میں اتار چڑھاؤ کی پیمائش کرنے کے لئے 14 سائیکل اے ٹی آر کا استعمال کریں ، اور اس کے مطابق اسٹاپ نقصان اور منافع کی سطح کو متحرک کریں۔ اسٹاپ نقصان 1.1 گنا اے ٹی آر اور منافع کا ہدف 2.0 گنا اے ٹی آر ہے ، اس ترتیب سے جیت کا تناسب 1 سے زیادہ ہے۔
اسٹریٹجک فوائد
- متعدد سگنل کی توثیق: رجحانات ، قیمت کی شکل اور متحرک اشارے کے ساتھ مل کر ، جعلی سگنل کے اثرات کو نمایاں طور پر کم کیا گیا ہے۔
- متحرک رسک مینجمنٹ: اے ٹی آر پر مبنی اسٹاپ نقصان اور منافع کی ترتیب ، جو مارکیٹ میں اتار چڑھاؤ کے مطابق خود بخود ایڈجسٹ کرنے کے قابل ہے ، جس سے فکسڈ پوائنٹس کی حدود سے بچا جاسکتا ہے۔
- رجحانات کی پیروی کی خصوصیت: یکساں لائن سسٹم کے ذریعہ رجحانات کا تعین کریں ، جو افقی یا نیچے کی مارکیٹ میں غیر ضروری تجارت سے بچنے کے لئے موثر ہے۔
- مکمل تجارتی فریم ورک: داخلہ ، باہر نکلنے اور پوزیشن کے انتظام کے لئے ایک مکمل حکمت عملی کا نظام شامل ہے۔
اسٹریٹجک رسک
- رجحان کی تاخیر: EMA کے پیچھے ہونے والے اشارے کے طور پر دیر سے داخلے کا سبب بن سکتا ہے ، اور تیزی سے اتار چڑھاؤ والے بازاروں میں بہترین داخلے کے نقطہ نظر سے محروم ہوسکتا ہے۔
- مارکیٹ کا خطرہ مرتب کریں: افقی مارکیٹوں میں ، بار بار مساوی لائن کراسنگ سے زیادہ تجارت ہوسکتی ہے۔
- جعلی توڑنے کا خطرہ: پیکنگ نگلنے کی شکل میں جعلی توڑنے کا خطرہ ہوسکتا ہے ، جس کو سخت خطرے کے کنٹرول کے ذریعے سنبھالنے کی ضرورت ہے۔
- سٹاپ نقصان کی ترتیب کا خطرہ: بہت چھوٹا اے ٹی آر ضرب بہت زیادہ بار بار روکنے کا سبب بن سکتا ہے ، جبکہ بہت بڑا ضرب بہت زیادہ خطرہ مول لے سکتا ہے۔
حکمت عملی کی اصلاح کی سمت
- ٹرانزیکشن اشارے متعارف کرایا: ٹرانزیکشن کی تصدیق کو شامل کرکے سگنل کی وشوسنییتا کو بہتر بنایا جاسکتا ہے۔
- اوسط لکیری سائیکل کو بہتر بنائیں: اوسط لکیری سائیکل کو مختلف مارکیٹ کی خصوصیات کے مطابق ایڈجسٹ کیا جاسکتا ہے ، تاکہ یہ مارکیٹ کی رفتار کو بہتر طور پر اپنائے۔
- نقصانات کو روکنے کے لئے بہتر طریقہ کار: آپ کو متحرک نقصانات کو شامل کرنے پر غور کر سکتے ہیں ، اور اگر رجحان جاری رہتا ہے تو تحفظ فائدہ مند ہے۔
- مارکیٹ کے ماحول میں فلٹرنگ میں اضافہ: اتار چڑھاؤ کی حد کا تعین متعارف کرایا گیا ہے ، جس سے مارکیٹ کے ماحول میں زیادہ اتار چڑھاؤ کے دوران تجارت کی تعدد میں کمی واقع ہوتی ہے۔
- آر ایس آئی پیرامیٹرز کو بہتر بنائیں: آپ کو تاریخ کے اعداد و شمار کی بنیاد پر بہترین آر ایس آئی thresholds اور حساب کی مدت تلاش کرنے کے لئے تلاش کر سکتے ہیں.
خلاصہ کریں۔
اس حکمت عملی میں متعدد تکنیکی اشارے کو مربوط کرکے ایک منطقی طور پر مکمل ٹرینڈ ٹریکنگ سسٹم بنایا گیا ہے۔ اس حکمت عملی کے فوائد متعدد سگنل کی توثیق اور متحرک رسک مینجمنٹ میں ہیں ، لیکن اس کے ساتھ ساتھ رجحان میں تاخیر اور جھوٹے توڑ جیسے خطرات سے نمٹنے پر بھی توجہ دی جانی چاہئے۔ اس حکمت عملی میں ٹرانسمیشن کی تصدیق ، پیرامیٹر کی ترتیبات کو بہتر بنانے اور اسی طرح کے طریقوں کو شامل کرکے ، اس حکمت عملی میں اب بھی بہتری کی جا سکتی ہے۔ مجموعی طور پر ، یہ حکمت عملی واضح رجحانات والی منڈیوں میں کام کرنے کے لئے موزوں ہے ، اور درمیانی اور طویل مدتی رجحانات کی پیروی کرنے کے لئے اس کی اچھی اطلاق کی قیمت ہے۔
- 1