ملٹی ٹائم پیریڈ لیکویڈیٹی حب ہیٹ میپ مقداری حکمت عملی

جائزہ
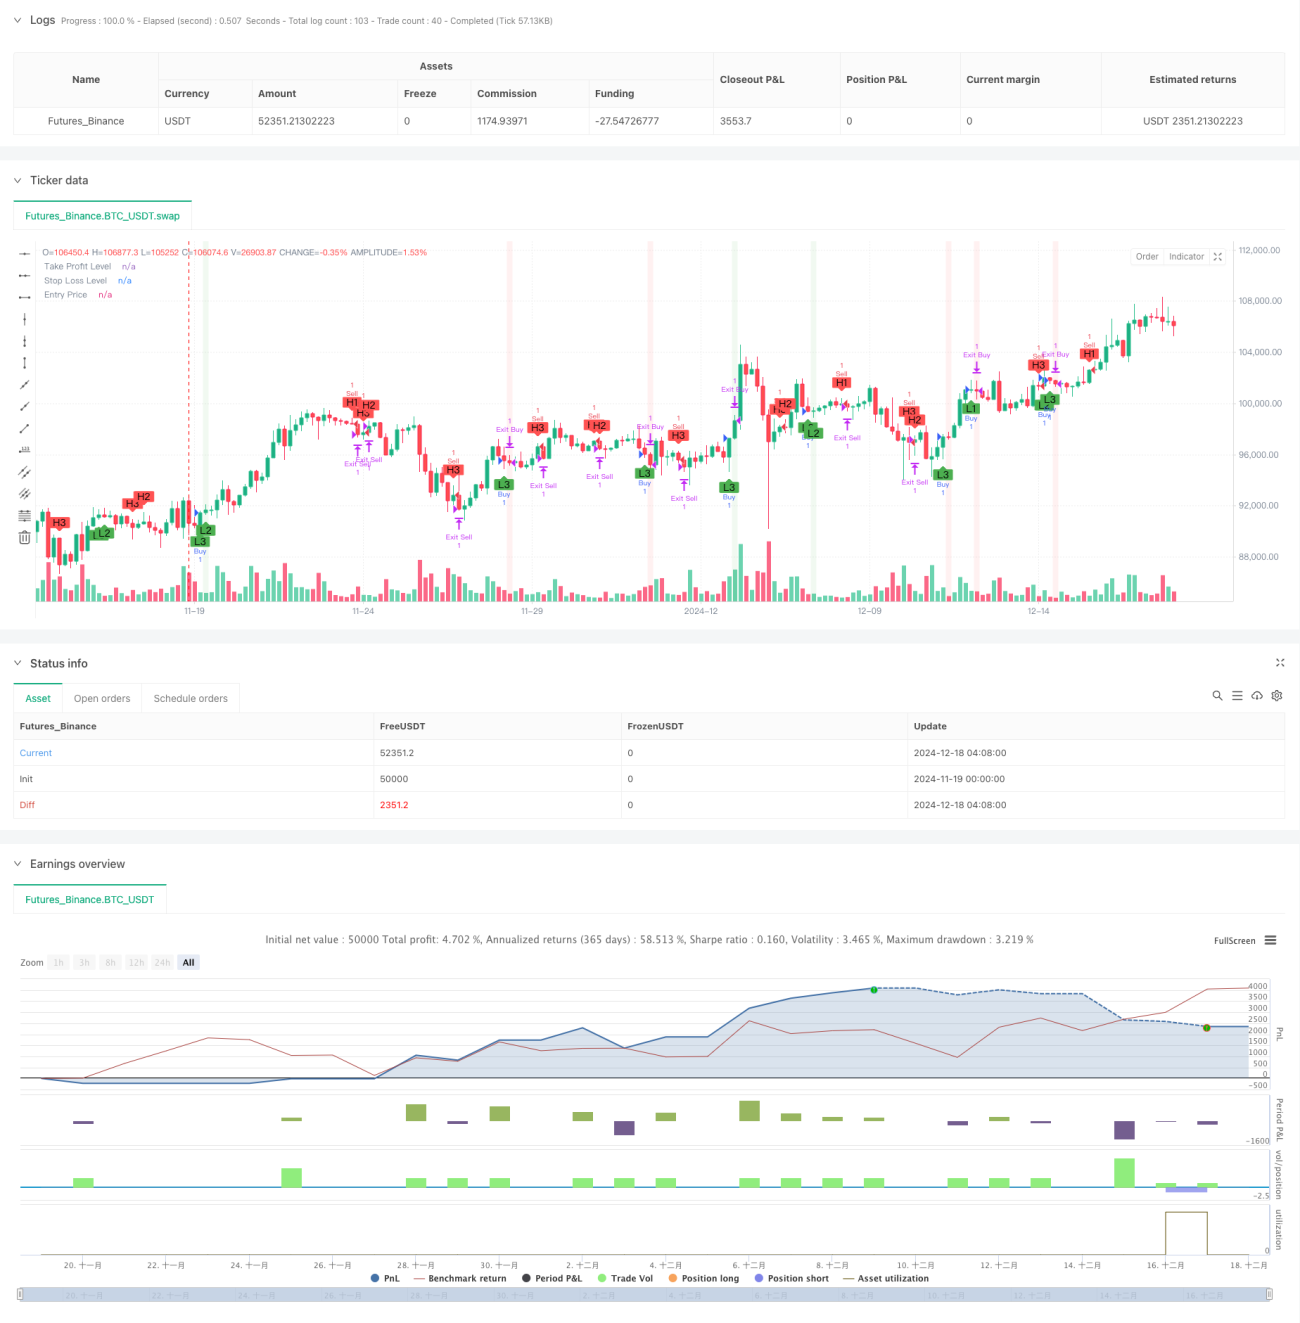
یہ حکمت عملی ایک مقداری تجارتی نظام ہے جو متعدد ٹائم پیکیج لیکویڈیٹی ہب پوائنٹ کا پتہ لگانے پر مبنی ہے۔ یہ تین مختلف ٹائم پیکیجز ((15 منٹ ، 1 گھنٹہ اور 4 گھنٹے) کی قیمتوں کے رویے کا تجزیہ کرکے اہم معاونت اور مزاحمت کی سطح کی نشاندہی کرتا ہے اور اس کی بنیاد پر تجارتی فیصلے کرتا ہے۔ نظام میں فنڈ مینجمنٹ کی خصوصیات کو مربوط کیا گیا ہے ، جس میں فکسڈ رقم کی اسٹاپ اور نقصان کی ترتیب بھی شامل ہے ، جبکہ بصری آراء فراہم کی جاتی ہیں ، جس سے تاجروں کو مارکیٹ کی ساخت کو بہتر طور پر سمجھنے میں مدد ملتی ہے۔
حکمت عملی کا اصول
اس حکمت عملی کا بنیادی حصہ یہ ہے کہ ta.pivothigh اور ta.pivotlow افعال کے ذریعہ متعدد ٹائم پیکیجز پر قیمت کے محوروں کا پتہ لگائیں۔ ہر ٹائم پیکیج کے لئے ، نظام اعلی اور کم نمایاں نقطہ کی نشاندہی کرنے کے لئے بائیں یا دائیں حوالہ K لائن کا استعمال کرتا ہے (ڈفالٹ 7). جب کسی بھی ٹائم پیکیج میں کوئی نیا محور کم ہوتا ہے تو ، نظام ایک سے زیادہ سگنل پیدا کرتا ہے۔ جب کوئی نیا محور اونچائی ہوتی ہے تو ، نظام ایک خالی سگنل پیدا کرتا ہے۔
اسٹریٹجک فوائد
- ملٹی ٹائم سائیکل تجزیہ مارکیٹ کا ایک جامع نقطہ نظر فراہم کرتا ہے ، جس سے مختلف سطحوں پر تجارتی مواقع کو پکڑنے میں مدد ملتی ہے۔
- گٹھ جوڑ پر مبنی ٹرانزیکشن لاجسٹکس مضبوط تکنیکی تجزیاتی بنیاد کے ساتھ ، آسانی سے سمجھنے اور ان پر عمل درآمد کرنے کے لئے
- انٹیگریٹڈ فنڈ مینجمنٹ فیچرز ہر ٹرانزیکشن کے خطرے کو مؤثر طریقے سے کنٹرول کرتے ہیں
- ایک بصری انٹرفیس جس میں ٹریڈنگ کی حیثیت ، بشمول پوزیشن ، اسٹاپ نقصان کی سطح اور منافع بخش علاقوں کو دکھایا جاتا ہے
- حکمت عملی کے پیرامیٹرز سایڈست ، لچکدار اور مختلف مارکیٹ کے حالات کے مطابق بہتر بنانے کے قابل ہیں
اسٹریٹجک رسک
- ایک سے زیادہ ٹائم پیکیج سگنل تنازعات کا سبب بن سکتے ہیں اور مناسب سگنل کی ترجیح کے طریقہ کار کی ضرورت ہے
- فکسڈ رقم کی روک تھام کی روک تھام تمام مارکیٹ کے حالات کے لئے موزوں نہیں ہوسکتی ہے اور اتار چڑھاؤ کی متحرکات کے مطابق ایڈجسٹ کرنے کی سفارش کی جاتی ہے
- مرکز کے ٹیسٹ میں تاخیر سے داخلے کے وقت میں تاخیر ہوسکتی ہے
- شدید اتار چڑھاؤ کے دوران غلط بریک سگنل کا امکان
- مختلف ٹائم فریموں میں نقل و حرکت کے اختلافات پر توجہ دیں
حکمت عملی کی اصلاح کی سمت
- اتار چڑھاؤ کے اشارے متعارف کرانے ، اسٹاپ نقصان کی سطح کو متحرک طور پر ایڈجسٹ کریں
- ٹرانزیکشن کی تصدیق کے طریقہ کار کو شامل کرنا اور مرکز کی وشوسنییتا کو بہتر بنانا
- ٹائم سائیکل ترجیحی نظام تیار کریں اور سگنل تنازعہ کو حل کریں
- ٹرینڈ فلٹرز کو مربوط کریں اور افقی مارکیٹوں میں زیادہ تجارت سے گریز کریں
- قیمتوں کے ڈھانچے کے تجزیے کو شامل کرنے پر غور کریں تاکہ اندراج کے وقت کی درستگی کو بہتر بنایا جاسکے
خلاصہ کریں۔
کثیر ٹائم سائیکل لیکویڈیٹی گٹھ جوڑ گرمی گراف کی حکمت عملی ایک منظم ، منطقی اور واضح تجارتی نظام ہے۔ یہ کثیر جہتی مارکیٹ تجزیہ اور سخت رسک مینجمنٹ کے ذریعہ تاجروں کو ایک قابل اعتماد تجارتی فریم ورک مہیا کرتا ہے۔ اگرچہ کچھ موروثی خطرات اور حدود موجود ہیں ، لیکن مسلسل اصلاح اور بہتری کے ذریعہ ، اس حکمت عملی کو مارکیٹ کے مختلف ماحول میں مستحکم کارکردگی کا مظاہرہ کرنے کی امید ہے۔
/*backtest
start: 2024-11-19 00:00:00
end: 2024-12-18 08:00:00
period: 4h
basePeriod: 4h
exchanges: [{"eid":"Futures_Binance","currency":"BTC_USDT"}]
*/

// This Pine Script™ code is subject to the terms of the Mozilla Public License 2.0 at https://mozilla.org/MPL/2.0/
// © pmotta41
//@version=5
strategy("GPT Session Liquidity Heatmap Strategy", overlay=true)- 1