متعدد ٹرینڈ لائن پیش رفت کراس اوور مقداری حکمت عملی

حکمت عملی کا جائزہ
یہ حکمت عملی ایک ذہین تجارتی نظام ہے جو ایک سے زیادہ ٹرینڈ لائن توڑنے پر مبنی ہے۔ یہ متحرک طور پر اہم معاون مزاحمت کی سطح کی نشاندہی کرتا ہے ، متعدد تکنیکی اشارے کے ساتھ مل کر رجحان لائن کے سلپ کا حساب لگاتا ہے ، اور جب قیمت ٹرینڈ لائن کو توڑتی ہے تو تجارت کرتی ہے۔ یہ حکمت عملی نہ صرف مارکیٹ کے رجحانات کے موڑ کو پکڑ سکتی ہے بلکہ پیرامیٹرز کو بہتر بنانے کے ذریعہ مختلف مارکیٹ کے حالات کے مطابق بھی اپنایا جاسکتا ہے۔
حکمت عملی کا اصول
حکمت عملی کے بنیادی منطق میں تین اہم حصے شامل ہیں: سب سے پہلے ، اہم اونچائیوں اور نچلی سطحوں کی شناخت ، ابتدائی معاونت کی مزاحمت کی سطح کو تشکیل دینے کے لئے ، پیچھے کی طرف دیکھنے کی مدت کے ذریعے؛ دوسرا ، رجحان لائن کے سلپ کو متحرک طور پر حساب کتاب کرنے کے لئے ، جس سے رجحان لائن کو مارکیٹ میں اتار چڑھاؤ کے ل better بہتر طور پر ڈھالنے کے قابل بنایا جاسکتا ہے ، حساب کتاب کے منتخب کردہ طریقہ کار کے مطابق (ATR ، معیاری فرق یا لکیری رجعت) ؛ اور آخر میں ، قیمتوں اور رجحان لائنوں کے تعلقات کی نگرانی کرکے ، ایک تجارتی سگنل کو ٹرگر کیا جاتا ہے جب ایک بریک ہوتا ہے۔ اس نظام میں بیک پیمنٹنگ پیرامیٹرز کے ذریعہ حقیقی تجارتی ماحول کو ماڈل کرنے کے لئے بیک پیمنٹنگ پیرامیٹرز کو بھی شامل کیا گیا ہے۔
اسٹریٹجک فوائد
- لچکدار: حکمت عملی مختلف مارکیٹ کے حالات کے مطابق ڈھل سکتی ہے جس میں مختلف قسم کے ملاپ کے حساب کے طریقوں اور سایڈست پیرامیٹرز شامل ہیں
- بہتر رسک کنٹرول: ٹرینڈ لائن کی متحرک ایڈجسٹمنٹ کی صلاحیت ٹرینڈ کی تبدیلیوں کو بروقت شناخت کرنے میں مدد کرتی ہے اور جھوٹے بریک کے نقصانات کو کم کرتی ہے
- اچھے بصری اثرات: حکمت عملی واضح بصری آراء فراہم کرتی ہے ، بشمول رجحان لائن توسیع اور بریک مارکر
- سگنل کی توثیق کا طریقہ کار: متعدد شرائط کی توثیق کے ذریعہ تجارتی سگنل کی وشوسنییتا کو یقینی بنانا
اسٹریٹجک رسک
- مارکیٹ میں شدید اتار چڑھاؤ کے دوران غلط سگنل پیدا ہوسکتے ہیں
- رجحان لائن کی حساب کتاب میں تاخیر سے داخلے کے وقت میں تھوڑا سا تاخیر ہوسکتی ہے
- پیرامیٹرز کا غلط انتخاب زیادہ تجارت یا اہم مواقع سے محروم ہوسکتا ہے
- مارکیٹس میں بار بار جھوٹے بریک سگنل کا امکان
حکمت عملی کی اصلاح کی سمت
- ٹرانزٹ کے اشارے متعارف کروائے گئے ہیں تاکہ انٹریوں کی افادیت کی تصدیق کی جا سکے۔
- مارکیٹ میں اتار چڑھاؤ کی شرح فلٹر شامل کریں ، اعلی اتار چڑھاؤ کے دوران پیرامیٹرز کو ایڈجسٹ کریں
- سگنل کی درستگی کو بہتر بنانے کے لئے دیگر تکنیکی اشارے کو مربوط کرنا
- خود کار طریقے سے پیرامیٹرز ایڈجسٹمنٹ میکانیزم تیار کریں
- اسٹاپ نقصان اور منافع میں اضافے کے لئے ذہین حساب کتاب کا طریقہ
خلاصہ کریں۔
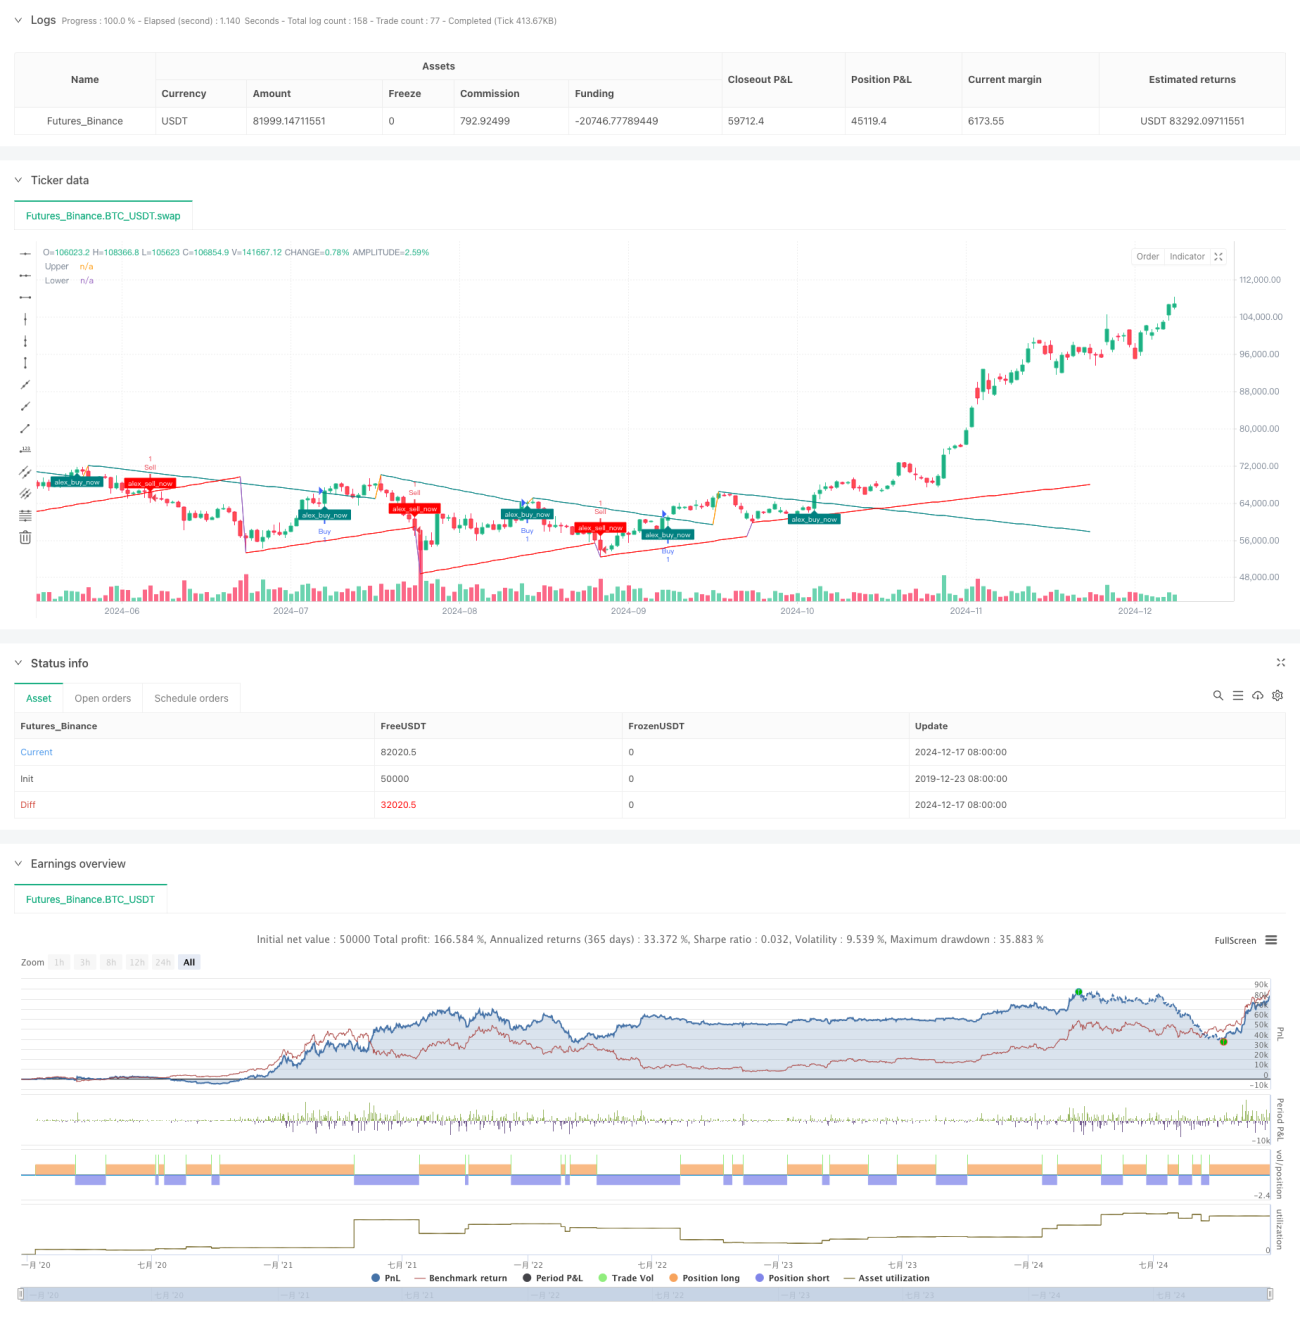
اس حکمت عملی نے متعدد تکنیکی تجزیہ کے طریقوں کو مربوط کرکے ایک قابل اعتماد ٹرینڈ لائن توڑنے والا تجارتی نظام تشکیل دیا ہے۔ اس کا فائدہ یہ ہے کہ مارکیٹ میں ہونے والی تبدیلیوں کو متحرک طور پر اپنانے کے ساتھ ساتھ واضح تجارتی سگنل فراہم کریں۔ اگرچہ اس میں کچھ موروثی خطرات موجود ہیں ، لیکن مناسب پیرامیٹرز کی ترتیب اور مسلسل اصلاح کے ذریعہ حکمت عملی کی استحکام اور منافع کو نمایاں طور پر بڑھایا جاسکتا ہے۔
/*backtest
start: 2019-12-23 08:00:00
end: 2024-12-18 08:00:00
period: 1d
basePeriod: 1d
exchanges: [{"eid":"Futures_Binance","currency":"BTC_USDT"}]
*/

// This Pine Script™ code is subject to the terms of the Mozilla Public License 2.0 at https://mozilla.org/MPL/2.0/
// © Alexgoldhunter

//@version=5- 1