
جائزہ
یہ حکمت عملی ایک اختیارات کی تجارت کی حکمت عملی ہے جو متعدد تکنیکی اشارے کے مجموعے پر مبنی ہے۔ بنیادی طور پر ای ایم اے کراس کو بنیادی سگنل کے طور پر استعمال کیا جاتا ہے ، ایس ایم اے ، وی ڈبلیو اے پی کے ساتھ مل کر رجحان کی سمت کی تصدیق کی جاتی ہے ، اور ایم اے سی ڈی اور آر ایس آئی کو معاون اشارے کے طور پر استعمال کرتے ہوئے سگنل فلٹرنگ کی جاتی ہے۔ اس حکمت عملی میں فکسڈ اسٹاپ پوزیشن مینجمنٹ رسک کا استعمال کیا جاتا ہے ، جس میں سخت داخلے کی شرائط اور پوزیشن مینجمنٹ کے ذریعہ تجارت کی کامیابی کی شرح میں اضافہ ہوتا ہے۔
حکمت عملی کا اصول
حکمت عملی 8 اور 21 دوروں کے ای ایم اے کے کراس کو بنیادی تجارتی سگنل کے طور پر استعمال کرتی ہے ، اور جب طویل مدتی ای ایم اے کو مختصر مدت کے ای ایم اے پر عبور کرتے ہیں اور مندرجہ ذیل شرائط پر پورا اترتے ہیں تو متعدد سگنل کو متحرک کرتے ہیں: قیمت 100 اور 200 دوروں کے ایس ایم اے سے اوپر ہے ، ایم اے سی ڈی لائن سگنل لائن سے اوپر ہے ، آر ایس آئی 50 سے زیادہ ہے۔ ۔ ۔ ۔
اسٹریٹجک فوائد
- کثیر اشارے کے تعاون سے ، سگنل کی وشوسنییتا کو مختلف دورانیوں اور اقسام کے اشارے کے ذریعہ کراس کی توثیق سے بہتر بنانا
- رجحانات کو پکڑنے کے ساتھ ساتھ قلیل مدتی حرکیات پر توجہ دینے کے لئے رجحانات کی پیروی اور متحرک اشارے کے ساتھ مل کر استعمال کریں
- فکسڈ اسٹاپ پوائنٹس منافع کو بچانے اور ضرورت سے زیادہ لالچ سے بچنے میں مدد کرتے ہیں
- پوزیشنوں کے سخت انتظام سے پوزیشنوں کے دوبارہ کھلنے سے بچنے اور خطرے کی نمائش کو کم کرنا
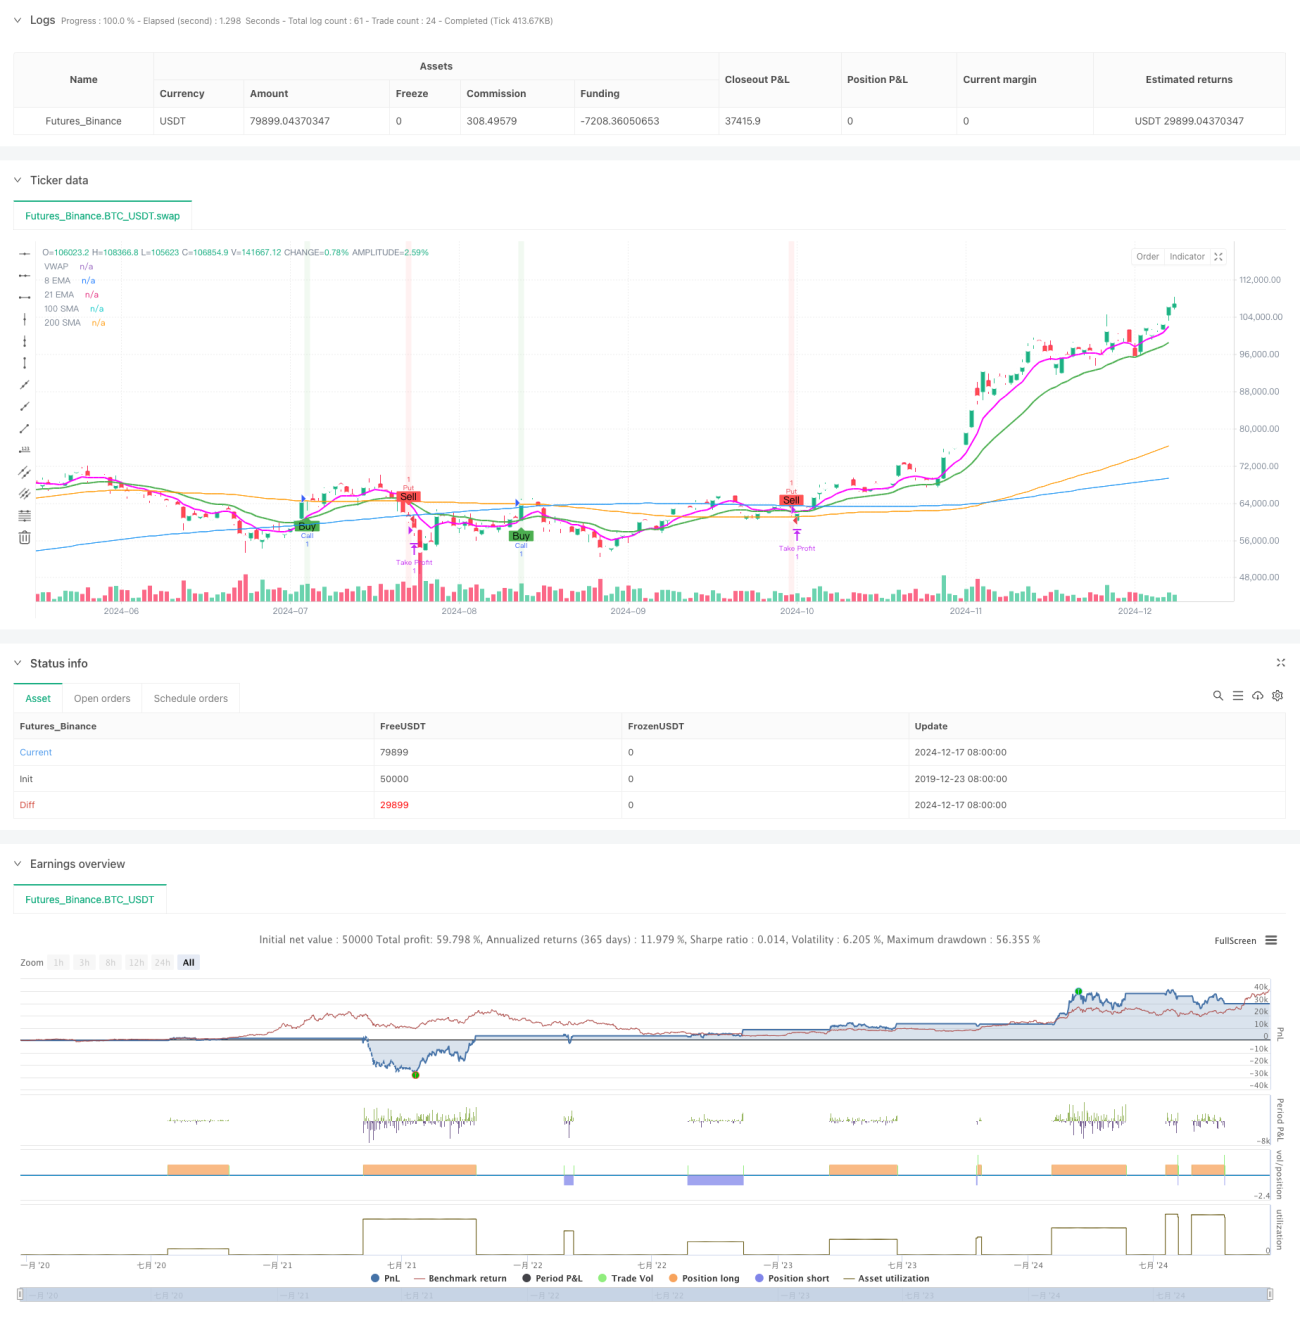
- EMA، SMA، VWAP رجحانات اور سگنل کے نشانات کے ساتھ واضح بصری اثرات
اسٹریٹجک رسک
- متواتر غلط سگنل غیر مستحکم بازاروں میں ہو سکتے ہیں۔
- فکسڈ اسٹاپ پوائنٹس سے زیادہ منافع کے مواقع ضائع ہوسکتے ہیں
- کوئی سٹاپ نقصان سیٹ نہیں ہے، انتہائی حالات میں زیادہ نقصان برداشت کیا جا سکتا ہے
- ایک سے زیادہ اشارے کا استعمال سگنل میں تاخیر کا سبب بن سکتا ہے
- کم لیکویڈیٹی والے اختیارات کے معاہدوں میں ، ممکنہ طور پر پرچی کے خطرے کا سامنا کرنا پڑتا ہے
حکمت عملی کی اصلاح کی سمت
- مارکیٹ میں اتار چڑھاؤ کی رفتار کے مطابق ایڈجسٹ کرنے کے لئے ایک انکولی سٹاپ نقصان کا نظام متعارف کرایا
- حجم کے انتظام کے ماڈیول میں اضافہ ، اکاؤنٹ کے سائز اور مارکیٹ کی صورتحال کے مطابق پوزیشنوں کو متحرک طور پر ایڈجسٹ کرنا
- مارکیٹ میں اتار چڑھاؤ کے فلٹر کو شامل کریں تاکہ اعلی اتار چڑھاؤ والے ماحول میں حکمت عملی کے پیرامیٹرز کو ایڈجسٹ کیا جاسکے
- اشارے کے پیرامیٹرز کو بہتر بنانے کے لئے ، مستقل دورانیے کے بجائے موافقت پذیر دورانیے کا استعمال کرنے پر غور کیا جاسکتا ہے
- وقت کے فلٹر کو شامل کریں تاکہ مارکیٹ کے کھلنے اور بند ہونے جیسے زیادہ اتار چڑھاؤ کے اوقات میں تجارت سے بچا جاسکے۔
خلاصہ کریں۔
یہ ایک منظم ، منطقی طور پر واضح ، کثیر اشارے کی رجحان ٹریکنگ آپشن ٹریڈنگ حکمت عملی ہے۔ حکمت عملی تجارتی سگنل کی وشوسنییتا کو بڑھانے کے لئے متعدد تکنیکی اشارے کے ہم آہنگی کے ساتھ کام کرتی ہے ، اور فکسڈ اسٹاپ پوائنٹ بیس کا استعمال کرکے خطرے کا انتظام کرتی ہے۔ اگرچہ حکمت عملی میں کچھ موروثی خطرات موجود ہیں ، لیکن تجویز کردہ اصلاح کی سمت سے حکمت عملی کی استحکام اور منافع کو مزید بہتر بنایا جاسکتا ہے۔ حکمت عملی کا بصری ڈیزائن تاجروں کو بصری طور پر تجارتی سگنل کو سمجھنے اور اس پر عمل درآمد کرنے میں بھی مدد کرتا ہے۔
/*backtest
start: 2019-12-23 08:00:00
end: 2024-12-18 08:00:00
period: 1d
basePeriod: 1d
exchanges: [{"eid":"Futures_Binance","currency":"BTC_USDT"}]
*/

//@version=5
strategy("OptionsMillionaire Strategy with Take Profit Only", overlay=true, default_qty_type=strategy.fixed, default_qty_value=1)

// Define custom magenta color- 1