
خلاصہ
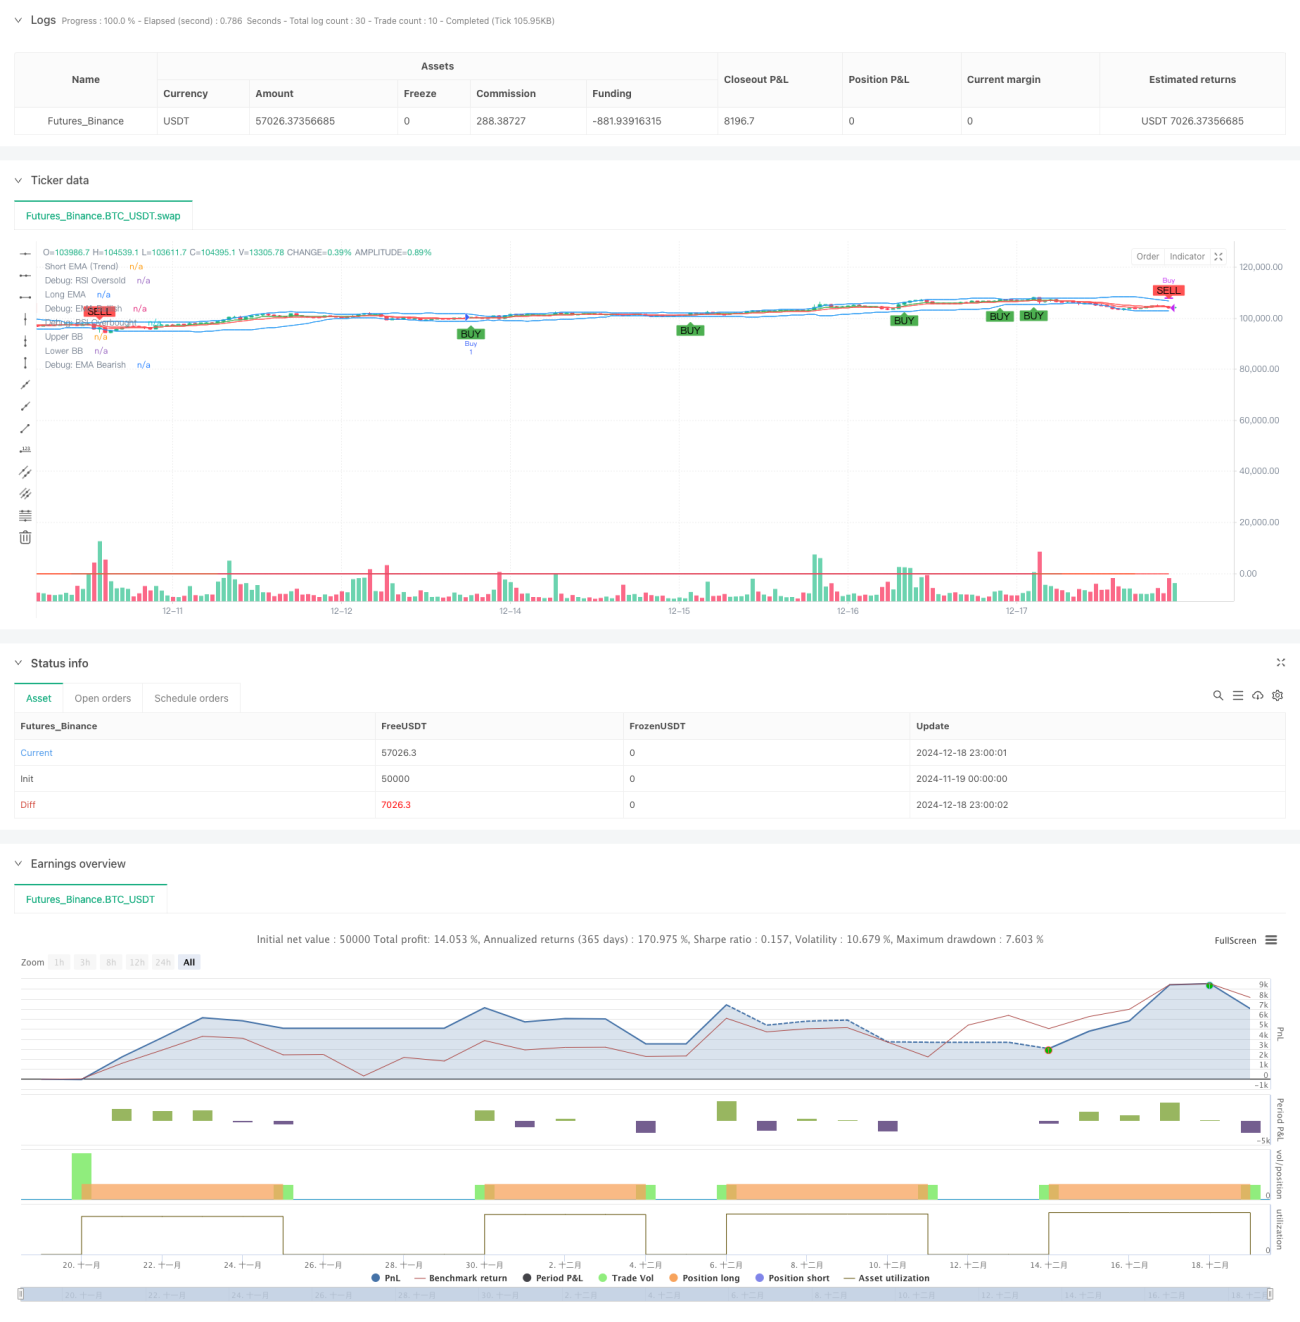
یہ حکمت عملی ایک جامع تجارتی نظام ہے جو متعدد تکنیکی اشاریوں کو یکجا کرتی ہے، بنیادی طور پر مارکیٹ کی حرکت پذیری اور رجحان کی تبدیلیوں کی متحرک نگرانی کے ذریعے تجارتی مواقع حاصل کرنے پر توجہ مرکوز کرتی ہے۔ اس حکمت عملی میں متعدد اشاریے جیسے کہ متحرک اوسط کا نظام (EMA)، رشتہ دار طاقت کا اشاریہ (RSI)، متحرک اوسط کنورجنس ڈائیورجنس (MACD)، اور بولنگر بینڈز (BB) شامل ہیں، اور اس میں حقیقی اتار چڑھاؤ (ATR) پر مبنی ایک متحرک نقصان روکنے کا طریقہ کار متعارف کرایا گیا ہے، جس سے مارکیٹ کے کثیر جہتی تجزیے اور خطرے پر قابو پانے میں مدد ملتی ہے۔
حکمت عملی کا اصول
یہ حکمت عملی ایک کثیر سطحی سگنل تصدیقی طریقہ کار اپناتی ہے، جس میں بنیادی طور پر درج ذیل پہلو شامل ہیں:
- رجحان کا تعین: مارکیٹ کے رجحان کی سمت کا تعین کرنے کے لیے 7-دورانیہ اور 14-دورانیہ کے EMA کے کراس اوور کا استعمال کیا جاتا ہے۔
- حرکت پذیری کا تجزیہ: RSI اشاریہ کے ذریعے مارکیٹ کی زیادہ خرید/زیادہ فروخت کی حالت کی نگرانی کی جاتی ہے، اور 30/70 کی متحرک حد مقرر کی گئی ہے۔
- رجحان کی مضبوطی کی تصدیق: ADX اشاریہ کا استعمال کرتے ہوئے رجحان کی مضبوطی کا تعین کیا جاتا ہے، جب ADX > 25 ہوتا ہے تو مضبوط رجحان کی موجودگی کی تصدیق ہوتی ہے۔
- اتار چڑھاؤ کے دائرے کا تعین: قیمت کے اتار چڑھاؤ کے دائرے کی حد بندی کے لیے بولنگر بینڈز کا استعمال کیا جاتا ہے، اور قیمت کے بولنگر بینڈز کو چھونے کی صورت میں تجارتی سگنل پیدا ہوتے ہیں۔
- حجم کی تصدیق: متحرک حجم کی اوسط کا استعمال کرتے ہوئے فلٹر کیا جاتا ہے تاکہ یہ یقینی بنایا جا سکے کہ تجارت مناسب مارکیٹ سرگرمی کے تحت ہو رہی ہے۔
- خطرے کا کنٹرول: ATR اشاریہ پر مبنی متحرک نقصان روکنے کی حکمت عملی، نقصان روکنے کا فاصلہ 1.5 گنا ATR ہے۔
حکمت عملی کے فوائد
- کثیر جہتی سگنل کی تصدیق، جس سے جعلی سگنلز کو مؤثر طریقے سے کم کیا جا سکتا ہے۔
- متحرک نقصان روکنے کا طریقہ کار حکمت عملی کی خطرے سے نمٹنے کی صلاحیت کو بڑھاتا ہے۔
- حجم اور رجحان کی مضبوطی کے تجزیے کو شامل کرنے سے تجارت کی وشوسنییتا میں اضافہ ہوتا ہے۔
- اشاریوں کے پیرامیٹرز کو ایڈجسٹ کیا جا سکتا ہے، جس سے اچھی موافقت ہوتی ہے۔
- داخلے اور خارج ہونے کا مکمل طریقہ کار، واضح تجارتی منطق۔
- معیاری تکنیکی اشاریوں کا استعمال، جسے سمجھنا اور برقرار رکھنا آسان ہے۔
حکمت عملی کے خطرات
- متعدد اشاریے سگنل میں تاخیر کا سبب بن سکتے ہیں۔
- پیرامیٹر کی اصلاح میں زیادہ فٹنگ کا خطرہ ہو سکتا ہے۔
- سائیڈ ویز مارکیٹ میں بار بار تجارت ہو سکتی ہے۔
- پیچیدہ سگنل سسٹم کمپیوٹیشنل بوجھ بڑھا سکتا ہے۔
- حکمت عملی کی افادیت کی تصدیق کے لیے بڑے نمونے کے سائز کی ضرورت ہے۔
حکمت عملی کی اصلاح کی سمت
- مارکیٹ کے اتار چڑھاؤ کے لیے خودکار موافقت کا طریقہ کار متعارف کروائیں، اور اشاریوں کے پیرامیٹرز کو متحرک طور پر ایڈجسٹ کریں۔
- وقت کا فلٹر شامل کریں، تاکہ ناگوار اوقات میں تجارت سے بچا جا سکے۔
- منافع روکنے کی حکمت عملی کو بہتر بنائیں، متحرک منافع روکنے پر غور کیا جا سکتا ہے۔
- تجارتی لاگت پر غور کریں، اور کھولنے اور بند کرنے کی شرائط کو بہتر بنائیں۔
- پوزیشن مینجمنٹ کا طریقہ کار متعارف کروائیں، تاکہ پوزیشن کے سائز کو متحرک طور پر ایڈجسٹ کیا جا سکے۔
خلاصہ
یہ حکمت عملی متعدد اشاریوں کے باہمی تعاون کے ذریعے ایک نسبتاً مکمل تجارتی نظام تشکیل دیتی ہے۔ بنیادی طاقت کثیر جہتی سگنل تصدیقی طریقہ کار اور متحرک خطرے پر قابو پانے کے نظام میں ہے، لیکن پیرامیٹر کی اصلاح اور مارکیٹ کی موافقت کے مسائل پر توجہ دینے کی ضرورت ہے۔ مسلسل اصلاح اور ایڈجسٹمنٹ کے ذریعے، یہ حکمت عملی مختلف مارکیٹ حالات میں مستحکم کارکردگی دکھانے کی امید رکھتی ہے۔
- 1