جائزہ
یہ حکمت عملی ایک اعلی درجے کی رجحان ٹریڈنگ سسٹم ہے جس میں مصنوعی ذہانت کی ٹیکنالوجی شامل ہے ، جس میں بنیادی طور پر وی پی ایس (فلوئڈیبل پرائس سسٹم) انحراف اشارے اور واہ رجحانات کا طریقہ ہے۔ یہ مارکیٹ میں اتار چڑھاؤ اور رجحان کی طاقت کی نشاندہی کرنے کے لئے وی پی ایس کا استعمال کرتا ہے ، جبکہ ممکنہ قیمتوں کے الٹ پوائنٹس کا پتہ لگانے کے لئے آر ایس آئی کے الٹ کے ساتھ مل کر کام کرتا ہے۔ یہ حکمت عملی کثیر جہتی دو طرفہ تجارت کے لئے ایک درست انٹری سگنل فراہم کرنے کے قابل ہے ، جس میں رجحان کی حرکیات اور الٹ کے تجزیے کو ایک ساتھ استعمال کرکے مارکیٹ کی پیش گوئی کی درستگی کو بڑھانا ہے۔
حکمت عملی کا اصول
یہ حکمت عملی تین بنیادی اجزاء پر مبنی ہے:
- WOW رجحان اشارے رجحان کی تبدیلی کی تصدیق کے لئے استعمال کیا جاتا ہے ((مختلف سمتوں سے یا اس کے برعکس)
- VPS کی شرائط کو اتار چڑھاؤ اور رجحان کی طاقت کی توثیق کرنے کے لئے استعمال کیا جاتا ہے
- RSI الٹ تجزیہ ممکنہ ٹرن آؤٹ پوائنٹس کی نشاندہی کرنے کے لئے
سسٹم سب سے پہلے اے ٹی آر پر مبنی متحرک سپورٹ اور مزاحمت کے راستے کا حساب لگاتا ہے ، جس میں وی پی ایس لمبائی پیرامیٹرز (ڈیفالٹ 11) کے ساتھ مل کر مارکیٹ کی حالت کا اندازہ لگایا جاتا ہے۔ جب قیمت اووربائڈ لیول (78) یا اوور سیل لیول (27) کو توڑ دیتی ہے تو ، نظام تجارتی سگنل کو متحرک کرتا ہے۔ اس کے ساتھ ہی ، حکمت عملی قیمت اور وی پی ایس اشارے کے مابین انحراف کی نگرانی کرتی ہے تاکہ تجارت کی سمت کی مزید تصدیق کی جاسکے۔
اسٹریٹجک فوائد
- کثیر جہتی تجزیہ: رجحانات ، اتار چڑھاؤ اور انحراف کے تجزیے کے ساتھ مل کر مارکیٹ کا ایک جامع نقطہ نظر فراہم کرنا
- لچکدار: متحرک اے ٹی آر چینل کا استعمال کرتے ہوئے ، مارکیٹ میں اتار چڑھاؤ کے مطابق خود بخود ایڈجسٹ ہوجاتا ہے
- اعلی درجے کی خطرے کے انتظام: ایک بلٹ میں سٹاپ نقصان کا طریقہ کار، جو پہلے سے طے شدہ منافع کے ہدف کے مطابق خود کار طریقے سے صفائی کرتا ہے
- سگنل کی توثیق کا طریقہ کار: ایک ہی وقت میں متعدد شرائط کو پورا کرنے کی ضرورت ہوتی ہے تاکہ تجارت کو متحرک کیا جاسکے ، جس سے جعلی سگنل کا امکان کم ہوجائے
- دو طرفہ تجارت کی صلاحیت: مارکیٹ کے اتار چڑھاو سے فائدہ اٹھانے کے لئے دو طرفہ تجارت کے بہت سارے مواقع پر قبضہ کرنا
اسٹریٹجک رسک
- مارکیٹ کا شور: افقی یا کم اتار چڑھاؤ والے ماحول میں جھوٹے اشارے پیدا ہوسکتے ہیں
- پیرامیٹر حساسیت: اشارے کے پیرامیٹرز کی ترتیبات (جیسے VPS لمبائی ، اوورلوڈ اوور سیل کی سطح) حکمت عملی کی کارکردگی پر زیادہ اثر انداز ہوتی ہیں
- سلائڈ پوائنٹ کا خطرہ: مختصر دورانیے (جیسے 5 منٹ) کے کاروبار میں ، سلائڈ پوائنٹ کے زیادہ اثرات کا سامنا کرنا پڑ سکتا ہے
- سگنل کی تاخیر: متعدد تصدیق کے میکانزم سے داخلے کے وقت میں تاخیر ہوسکتی ہے
- فنڈ مینجمنٹ: فکسڈ فنڈز کی تقسیم کا طریقہ مختلف مارکیٹ کے حالات میں مختلف ہوسکتا ہے
حکمت عملی کی اصلاح کی سمت
- متحرک پیرامیٹرز ایڈجسٹمنٹ: مارکیٹ کی حالت کے مطابق متحرک طور پر VPS لمبائی اور اوورلوڈ اوورلوڈ کی حد کو ایڈجسٹ کرنے کے لئے ایک موافقت پذیر پیرامیٹرز میکانزم متعارف کرایا جاسکتا ہے
- مارکیٹ کے حالات کو فلٹر کریں: مارکیٹ کے حالات کی شناخت کے ماڈیول کو شامل کریں ، غیر مناسب مارکیٹ کے حالات میں تجارت کو روکیں
- اسٹاپ نقصان کی اصلاح: اے ٹی آر کی بنیاد پر زیادہ لچکدار اسٹاپ نقصان کے میکانزم کو ڈیزائن کیا جاسکتا ہے ، جس سے خطرے پر قابو پانے کی درستگی میں اضافہ ہوتا ہے۔
- ٹائم سیزن کی اصلاح: مختلف تجارتی اوقات کی خصوصیات ، حکمت عملی کے پیرامیٹرز اور تجارتی قواعد کو ایڈجسٹ کرنا
- فنڈ مینجمنٹ کو بہتر بنانا: متحرک پوزیشن مینجمنٹ متعارف کرایا گیا ہے ، جس میں مارکیٹ میں اتار چڑھاؤ اور نقصان دہ صورتحال کے مطابق تجارت کا سائز ایڈجسٹ کیا گیا ہے۔
خلاصہ کریں۔
یہ ایک جامع تجارتی حکمت عملی ہے جس میں متعدد تکنیکی اشارے اور تجزیاتی طریقوں کا امتزاج کیا گیا ہے۔ روایتی تکنیکی تجزیہ کے ساتھ مصنوعی ذہانت کی ٹیکنالوجی کو جوڑ کر ، حکمت عملی استحکام کو برقرار رکھتے ہوئے اعلی تجارتی درستگی فراہم کرنے کے قابل ہے۔ حکمت عملی کا بنیادی فائدہ اس کے کثیر جہتی سگنل کی تصدیق کے طریقہ کار اور بہتر خطرے کے انتظام کے نظام میں ہے ، جبکہ اہم اصلاح کی گنجائش پیرامیٹرز کی متحرک ایڈجسٹمنٹ اور مارکیٹ کے ماحول کی شناخت میں ہے۔ مسلسل اصلاح اور بہتری کے ذریعہ ، اس حکمت عملی کو مختلف مارکیٹ کے ماحول میں مستحکم کارکردگی برقرار رکھنے کی امید ہے۔
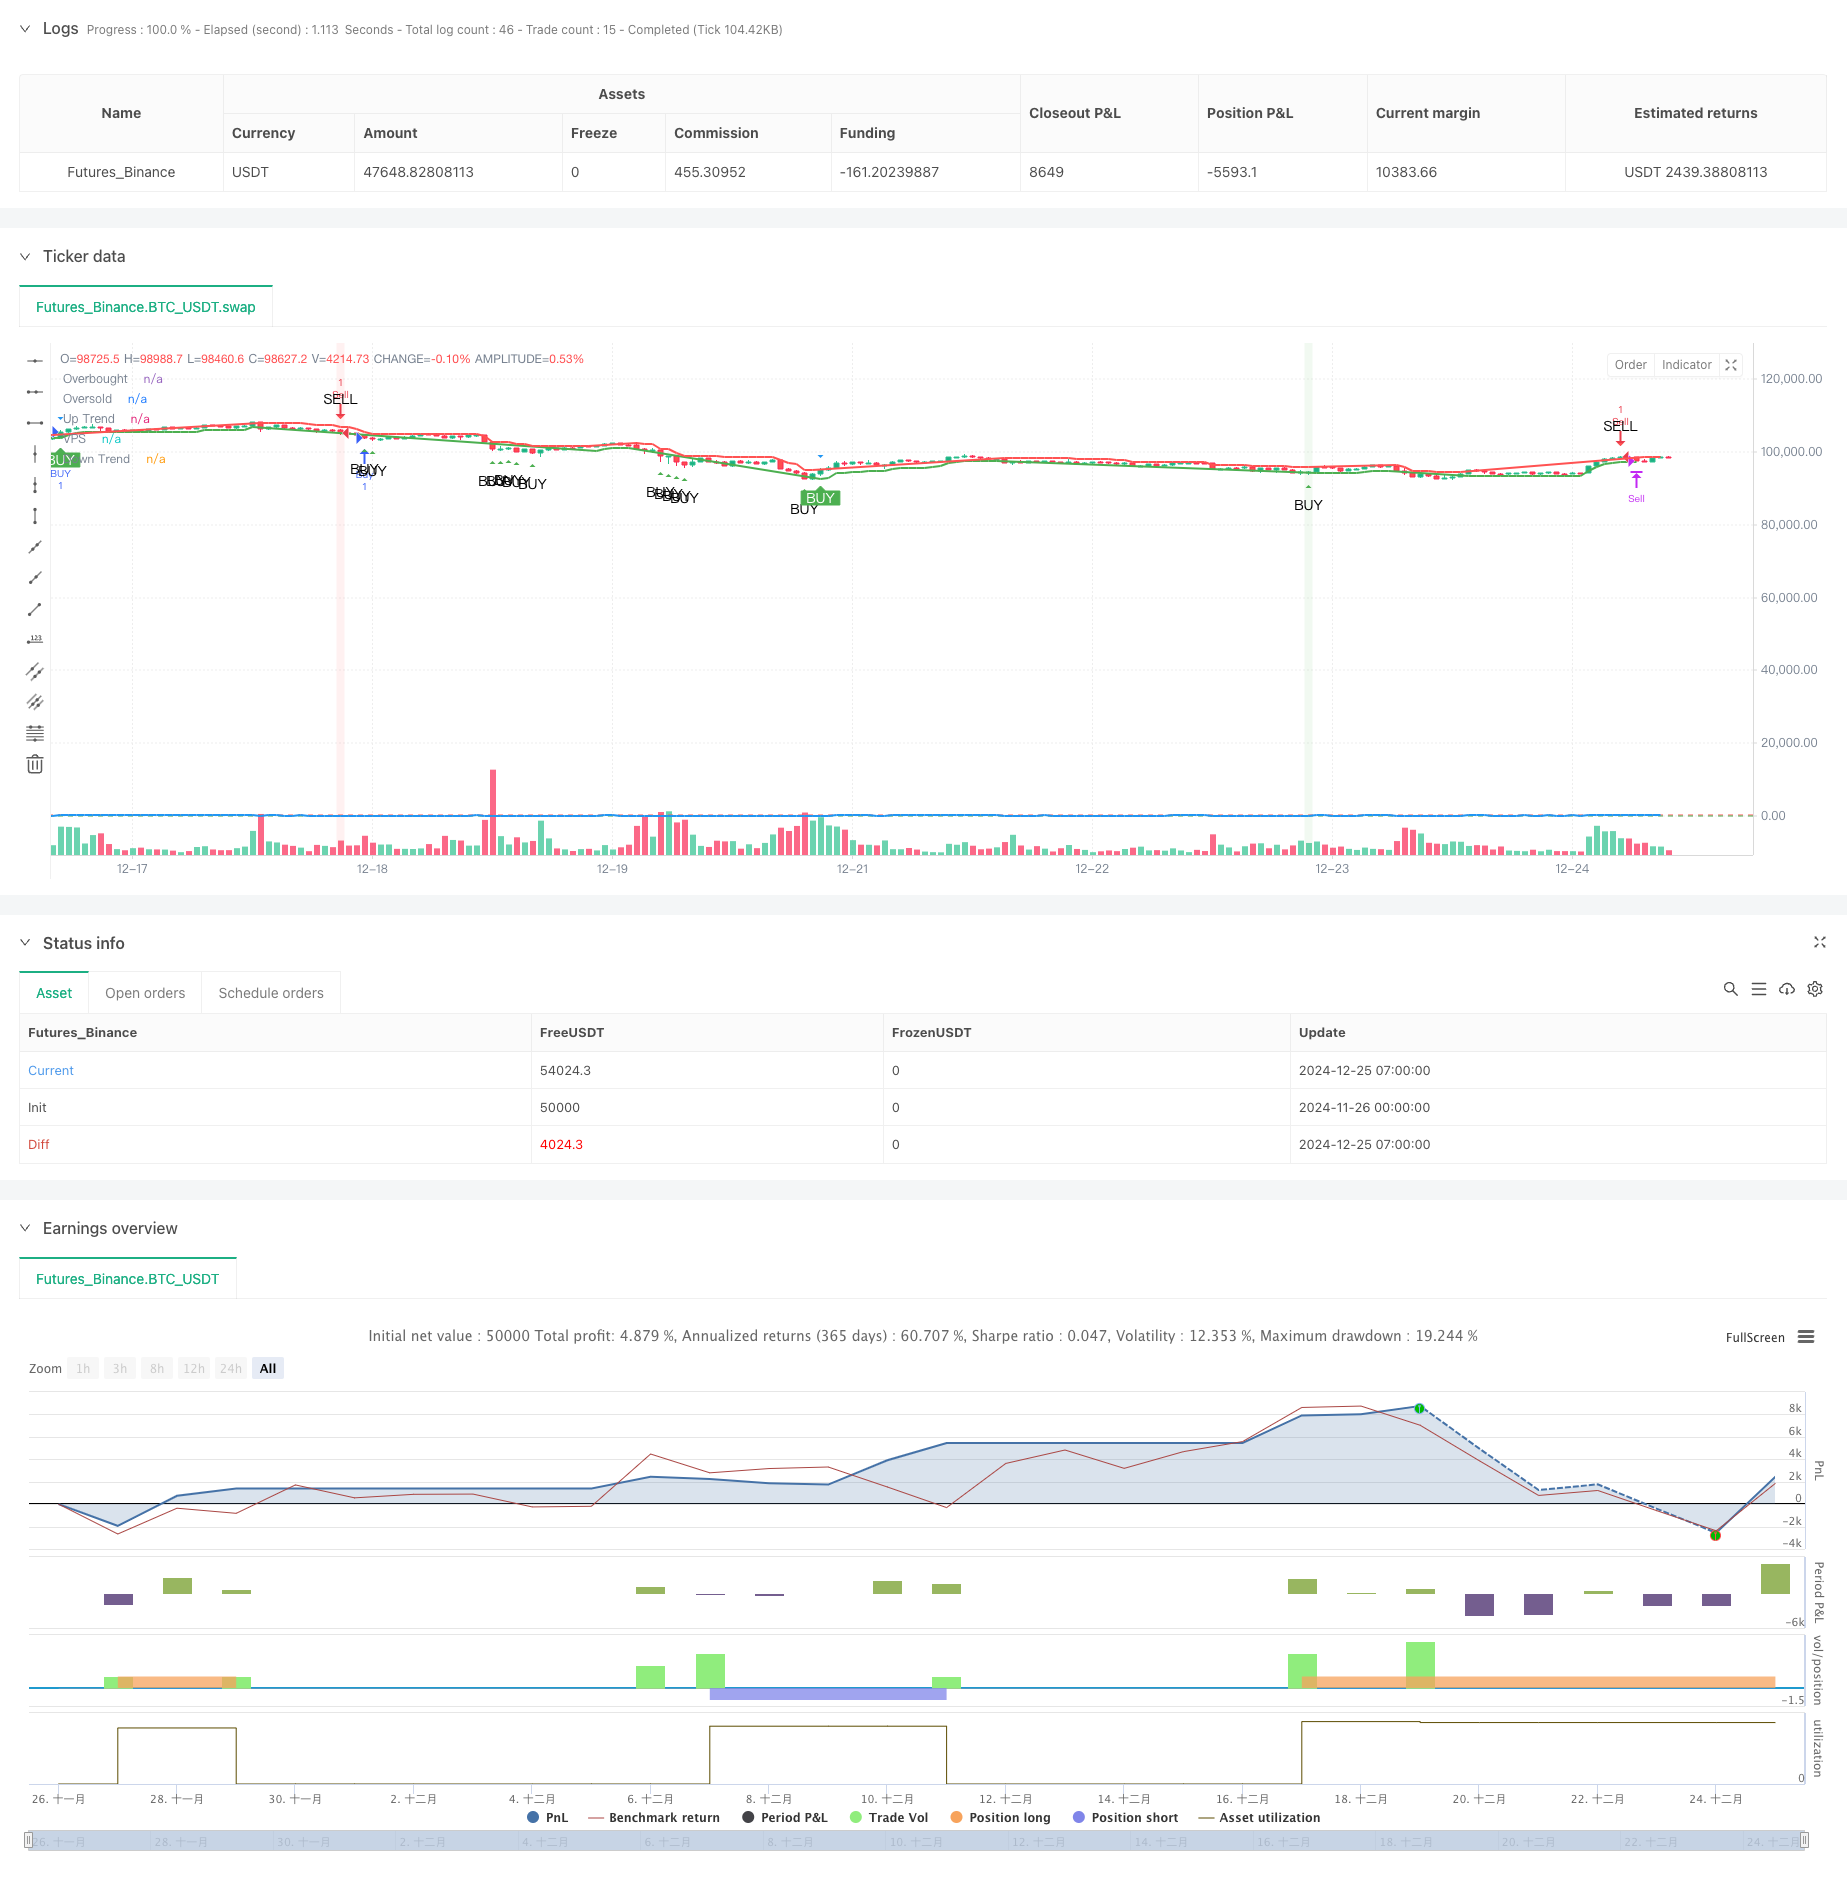
/*backtest
start: 2024-11-26 00:00:00
end: 2024-12-25 08:00:00
period: 1h
basePeriod: 1h
exchanges: [{"eid":"Futures_Binance","currency":"BTC_USDT"}]
*/

//@version=6
strategy("AI+VPS Vijay Prasad Strategy", overlay=true)

// --- VPS Divergence Strategy Inputs ---
vps_length = input.int(11, title="VPS Length")
vps_overbought = input.int(78, title="VPS Overbought Level")  // Overbought level for VPS
vps_oversold = input.int(27, title="VPS Oversold Level")  // Oversold level for VPS

// Calculate VPS (Relative Strength Index alternative) - here using a custom divergence condition
vps = ta.rsi(close, vps_length)

// Plot VPS on the chart
plot(vps, title="VPS", color=color.blue, linewidth=2)
hline(vps_overbought, "Overbought", color=color.red, linewidth=1)
hline(vps_oversold, "Oversold", color=color.green, linewidth=1)

// Define Buy and Sell Conditions based on Overbought/Oversold VPS
vps_buy_condition = vps < vps_oversold  // Buy signal when VPS is oversold
vps_sell_condition = vps > vps_overbought  // Sell signal when VPS is overbought

// Define Bullish and Bearish Divergence conditions
bullish_divergence = (low[1] < low[2] and vps[1] > vps[2] and low < low[1] and vps > vps[1])
bearish_divergence = (high[1] > high[2] and vps[1] < vps[2] and high > high[1] and vps < vps[1])

// Combine Buy and Sell signals:
// Buy when VPS is oversold or Bullish Divergence occurs
vps_buy_condition_final = vps_buy_condition or bullish_divergence
// Sell when VPS is overbought or Bearish Divergence occurs
vps_sell_condition_final = vps_sell_condition or bearish_divergence

// Plot Buy and Sell Signals
plotshape(series=vps_buy_condition_final, title="VPS Buy Signal", location=location.belowbar, color=color.green, style=shape.triangleup, text="BUY")
plotshape(series=vps_sell_condition_final, title="VPS Sell Signal", location=location.abovebar, color=color.red, style=shape.triangledown, text="SELL")

// VPS Divergence Highlight
bgcolor(bullish_divergence ? color.new(color.green, 90) : na)  // Highlight background for Bullish Divergence
bgcolor(bearish_divergence ? color.new(color.red, 90) : na)  // Highlight background for Bearish Divergence

// Strategy: Buy and Sell with target
if vps_buy_condition_final
    strategy.entry("Buy", strategy.long)

if vps_sell_condition_final
    strategy.entry("Sell", strategy.short)

// Capital settings for the strategy (for backtesting purposes)
capital_per_trade = input.float(1000, title="Capital per Trade (INR)", minval=1)
buy_target_inr = 1500  // Profit target for Buy in INR
sell_target_inr = 1000  // Profit target for Sell in INR

trade_value = close * (capital_per_trade / close)  // Value of one contract at current price

// Profit threshold calculation
buy_profit_target = buy_target_inr / trade_value  // Profit in price movement for Buy
sell_profit_target = sell_target_inr / trade_value  // Profit in price movement for Sell

// Exit based on profit targets
if strategy.position_size > 0
    profit_inr = (close - strategy.position_avg_price) * strategy.position_size
    if profit_inr >= buy_target_inr
        strategy.close("Buy", comment="Profit Target Reached")

if strategy.position_size < 0
    profit_inr = (strategy.position_avg_price - close) * -strategy.position_size
    if profit_inr >= sell_target_inr
        strategy.close("Sell", comment="Profit Target Reached")

// --- WoW Trends + VPS (Vijay Prasad Strategy) Logic ---
Periods = input.int(title="ATR Period", defval=10)
src = input.source(close, title="Source")
Multiplier = input.float(title="ATR Multiplier", step=0.1, defval=1.7)
changeATR = input.bool(title="Change ATR Calculation Method ?", defval=true)
showsignals = input.bool(title="Show Buy/Sell Signals ?", defval=true)

// --- ATR Calculation ---
atr2 = ta.sma(ta.tr, Periods)
atr = changeATR ? ta.atr(Periods) : atr2
up = src - (Multiplier * atr)
up1 = na(up[1]) ? up : up[1]
up := close[1] > up1 ? math.max(up, up1) : up
dn = src + (Multiplier * atr)
dn1 = na(dn[1]) ? dn : dn[1]
dn := close[1] < dn1 ? math.min(dn, dn1) : dn

// --- WoW Trends Logic ---
var trend = 1
trend := na(trend[1]) ? 1 : trend
trend := trend == -1 and close > dn1 ? 1 : trend == 1 and close < up1 ? -1 : trend

// --- VPS Logic (Vijay Prasad Strategy) ---
vpsVolatilityCondition = (high - low) > (1.5 * ta.sma(ta.tr, 20))  // VPS condition based on volatility
vpsTrendCondition = trend == 1  // VPS condition to check if trend is up
vpsSignal = vpsVolatilityCondition and vpsTrendCondition  // Combine both VPS conditions

// --- Buy/Sell Signal Logic ---
buySignal = trend == 1 and trend[1] == -1  // Signal to Buy (when trend switches to up)
sellSignal = trend == -1 and trend[1] == 1  // Signal to Sell (when trend switches to down)

// --- Combined Buy/Sell Signal Logic (WoW Trends + VPS) ---
combinedBuySignal = buySignal and vpsSignal
combinedSellSignal = sellSignal and vpsSignal

// --- Plot WoW Trends Lines using plot() ---
plot(trend == 1 ? up : na, title="Up Trend", color=color.green, linewidth=2)
plot(trend == -1 ? dn : na, title="Down Trend", color=color.red, linewidth=2)

// --- Plot VPS Signals ---
plotshape(vpsSignal and showsignals, title="VPS Signal", text="VPS", location=location.abovebar, style=shape.triangledown, size=size.small, color=color.blue, textcolor=color.white)

// --- Plot Combined Buy/Sell Signals ---
plotshape(combinedBuySignal and showsignals, title="Combined Buy Signal", text="BUY", location=location.belowbar, style=shape.labelup, size=size.small, color=color.green, textcolor=color.white)
plotshape(combinedSellSignal and showsignals, title="Combined Sell Signal", text="SELL", location=location.abovebar, style=shape.labeldown, size=size.small, color=color.red, textcolor=color.white)

// --- Strategy Entries ---
if (combinedBuySignal)
    strategy.entry("BUY", strategy.long)

if (combinedSellSignal)
    strategy.entry("SELL", strategy.short)

// --- Highlight Bars for Buy/Sell Signals ---
barcolor(combinedBuySignal ? color.green : na, offset=-1)
barcolor(combinedSellSignal ? color.red : na, offset=-1)