انکولی ڈائنامک ٹریڈنگ حکمت عملی نارملائزڈ لوگارتھمک ریٹرن پر مبنی

جائزہ
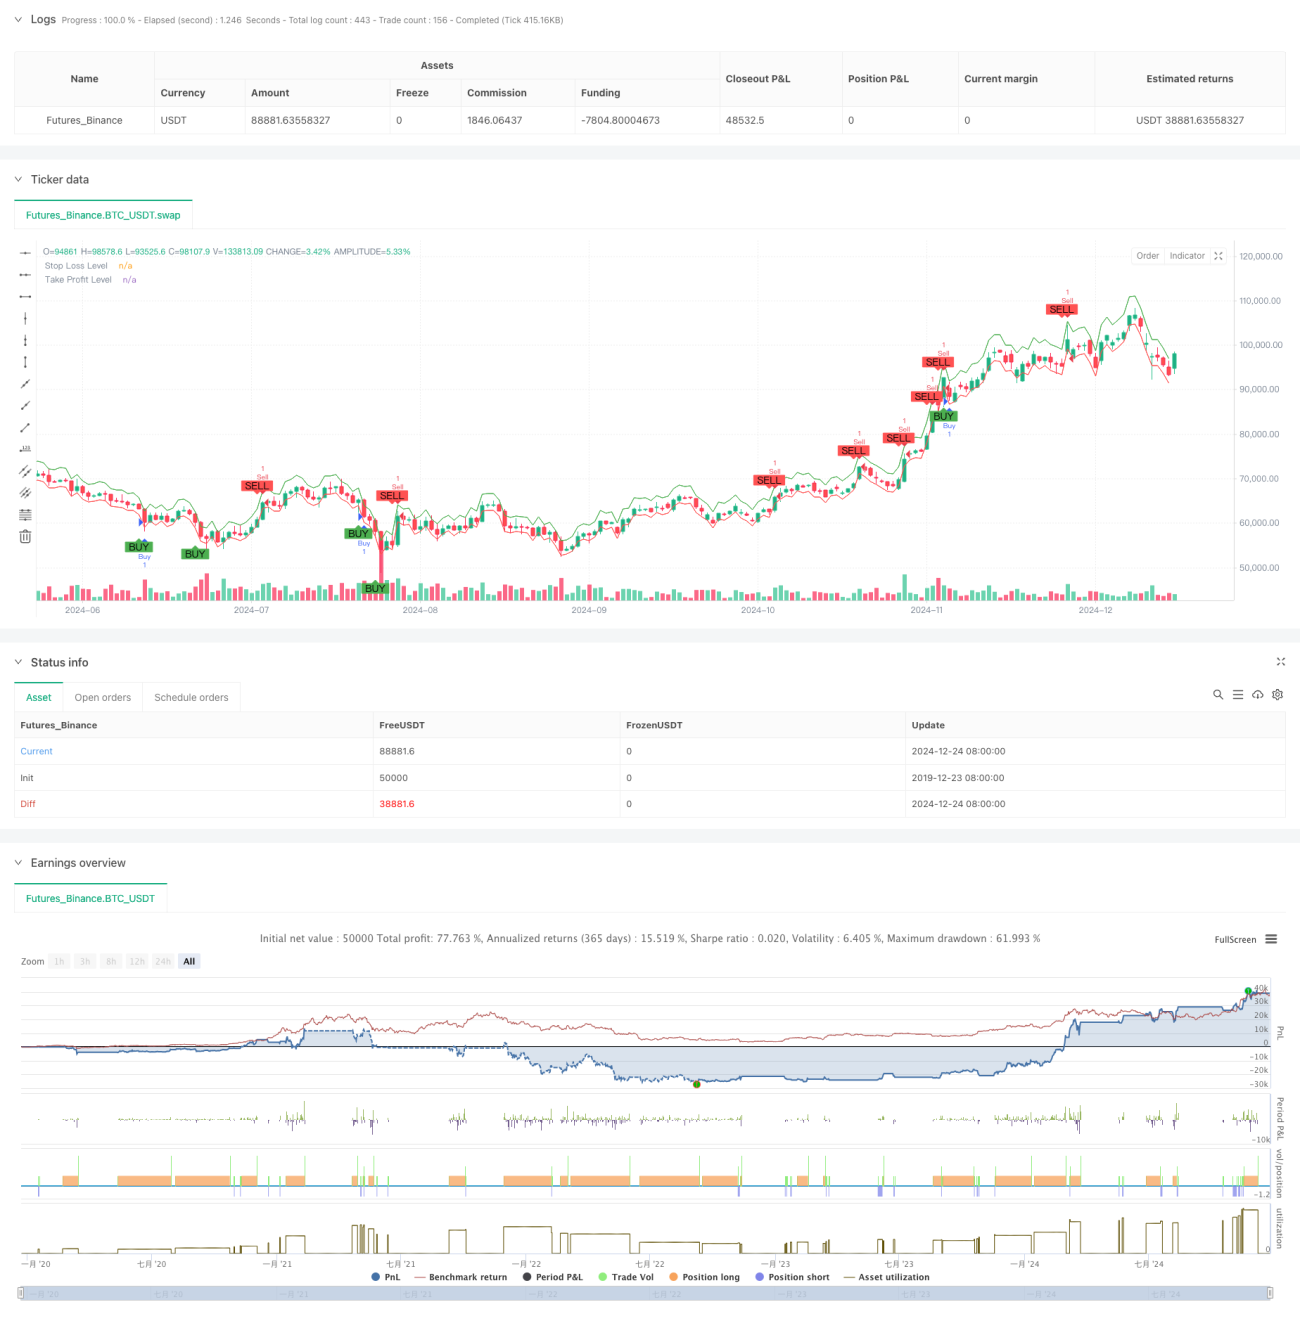
یہ حکمت عملی شیریائیف-زہو انڈیکس ((SZI) پر مبنی ایک خود کار طریقے سے ٹریڈنگ سسٹم ہے۔ یہ مارکیٹ میں زیادہ خرید اور زیادہ فروخت کے حالات کی نشاندہی کرنے کے لئے عددی منافع کی شرح کے معیاری اسکور کا حساب لگاتا ہے تاکہ قیمتوں میں اوسط واپسی کے مواقع کو پکڑ سکے۔ حکمت عملی میں متحرک اسٹاپ نقصان اور منافع بخش اہداف کا امتزاج ہوتا ہے تاکہ خطرے پر عین مطابق کنٹرول حاصل کیا جاسکے۔
حکمت عملی کا اصول
اس حکمت عملی کا بنیادی مقصد معیاری اشارے کی تعمیر کرنا ہے جس میں ہم آہنگی کی شرح منافع کی رولنگ اعداد و شمار کی خصوصیات شامل ہیں۔ اس کے لئے درج ذیل اقدامات ہیں:
- عددی واپسی کی شرح کا حساب لگانا تاکہ واپسی کی شرح کو درست طریقے سے سنبھال لیا جاسکے
- 50 دورانیہ ونڈو کا استعمال کرتے ہوئے رولنگ میڈین اور معیاری فرق کا حساب لگانا
- SZI انڈیکس کی تعمیر: (جدوجہد کی شرح منافع - رولنگ اوسط) / رولنگ معیاری فرق
- جب ایس آئی آئی کم سے کم -2.0 ہوتا ہے تو کثیر سگنل پیدا ہوتا ہے ، جب 2.0 سے زیادہ ہوتا ہے تو خالی سگنل پیدا ہوتا ہے
- 2٪ اسٹاپ نقصان اور 4٪ اسٹاپ اسٹاپ کی بنیاد پر لاگ ان قیمت کی سطح مقرر کریں
اسٹریٹجک فوائد
- ٹھوس نظریاتی بنیاد: اچھی طرح سے اعداد و شمار کی حمایت کے ساتھ، سمندری درست تقسیم کے مفروضے پر مبنی
- لچکدار: رولنگ ونڈو کے حساب سے ، مارکیٹ میں اتار چڑھاؤ کی خصوصیات میں تبدیلیوں کے مطابق ڈھالنے کے قابل
- خطرہ کنٹرول میں بہتری: فی صد اسٹاپ نقصان کی حکمت عملی کا استعمال کرتے ہوئے ، ہر تجارت کے خطرے پر عین مطابق کنٹرول حاصل کریں
- بصری دوستانہ: تجارتی سگنل اور خطرے کے کنٹرول کی سطح کو چارٹ پر واضح طور پر نشان زد کریں
اسٹریٹجک رسک
- پیرامیٹر حساسیت: رولنگ ونڈو کی لمبائی اور thresholds کے انتخاب سے حکمت عملی کی کارکردگی پر نمایاں اثر پڑتا ہے
- مارکیٹ کے ماحول پر انحصار: رجحان سازی مارکیٹ میں اکثر غلط سگنل پیدا ہوسکتے ہیں
- سلائڈ پوائنٹ اثر: شدید اتار چڑھاو کے دوران ، اصل قیمتوں میں نمایاں طور پر مطلوبہ سطح سے انحراف ہوسکتا ہے
- حساب کی تاخیر: ریئل ٹائم حساب سے متعلق اعدادوشمار کے اشارے کچھ سگنل تاخیر کا سبب بن سکتے ہیں
حکمت عملی کی اصلاح کی سمت
- متحرک حد: مارکیٹ میں اتار چڑھاؤ کی شرح کے مطابق متحرک طور پر سگنل کی حد کو ایڈجسٹ کرنے پر غور کیا جاسکتا ہے
- ایک سے زیادہ ٹائم سائیکل: ایک سے زیادہ ٹائم سائیکل متعارف کرانے کے لئے سگنل کی تصدیق کا طریقہ کار
- اتار چڑھاؤ کی شرح فلٹرنگ: انتہائی اتار چڑھاؤ کے دوران تجارت کو روکنا یا پوزیشن کو ایڈجسٹ کرنا
- سگنل کی تصدیق: اضافی اشارے کے لئے سگنل کی تصدیق کریں جیسے ٹرانزیکشن حجم ، طاقت وغیرہ
- پوزیشن مینجمنٹ: اتار چڑھاؤ پر مبنی متحرک پوزیشن مینجمنٹ
خلاصہ کریں۔
یہ ایک ٹھوس اعدادوشمار پر مبنی ایک مقداری تجارت کی حکمت عملی ہے جو معیاری عددی منافع کے ذریعہ قیمت کے اتار چڑھاؤ کے مواقع کو پکڑتی ہے۔ حکمت عملی کا بنیادی فائدہ اس کی خودکشی اور بہتر خطرے پر قابو پانے میں ہے ، لیکن پیرامیٹرز کے انتخاب اور مارکیٹ کے ماحول میں موافقت کے لحاظ سے ابھی بھی اصلاح کی گنجائش موجود ہے۔ متحرک کمی اور کثیر جہتی سگنل کی تصدیق کے طریقہ کار کو متعارف کرانے سے حکمت عملی کی استحکام اور وشوسنییتا میں مزید اضافہ ہونے کا امکان ہے۔
- 1