
جائزہ
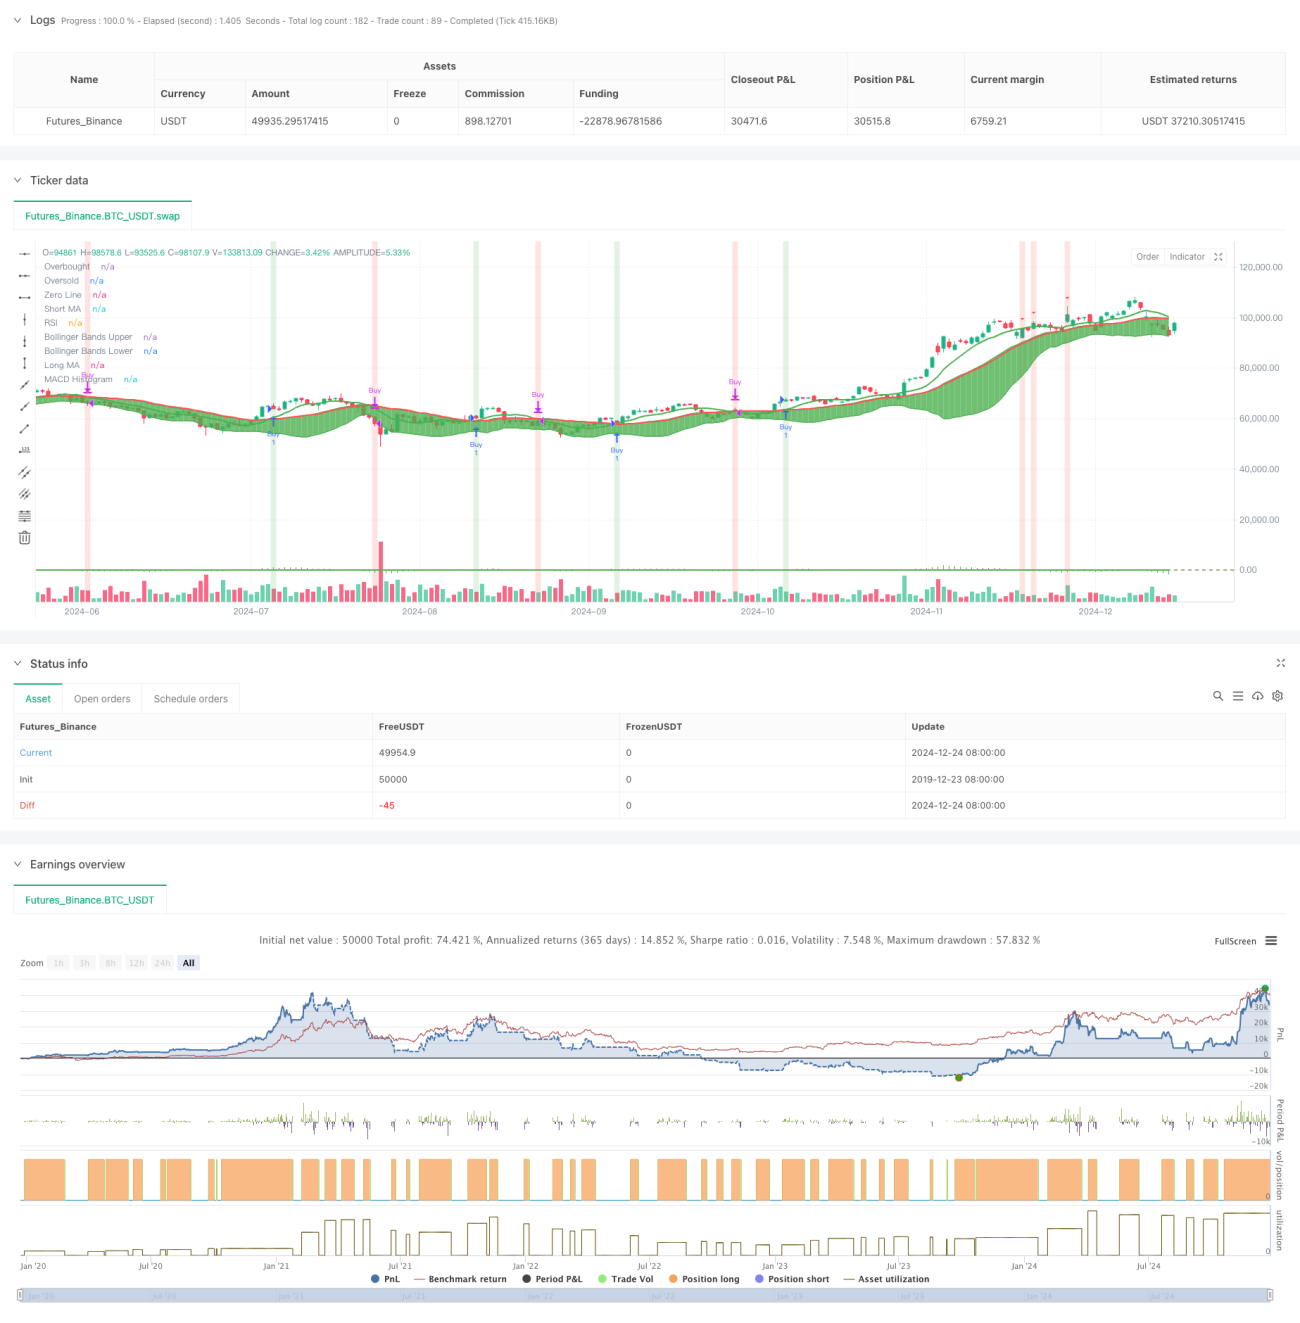
حکمت عملی ایک جامع تجارتی نظام ہے جو متعدد کلاسک تکنیکی اشارے کو یکجا کرتا ہے، بشمول موونگ ایوریج (MA)، رشتہ دار طاقت انڈیکس (RSI)، موونگ ایوریج کنورجنس ڈائیورجنس (MACD) اور بولنگر بینڈز (BB)۔ یہ نظام مارکیٹ میں خرید و فروخت کے زیادہ درست سگنلز تلاش کرنے کے لیے ان اشاریوں کے مربوط تعاون کا استعمال کرتا ہے، اس طرح لین دین کی کامیابی کی شرح میں بہتری آتی ہے۔
حکمت عملی کا اصول
حکمت عملی ایک کثیر پرت سگنل کی تصدیق کے طریقہ کار کو اپناتی ہے، جس میں بنیادی طور پر درج ذیل پہلو شامل ہیں:
- قلیل مدتی (9 دن) اور طویل مدتی (21 دن) حرکت پذیر اوسط کے کراس اوور کا استعمال کرکے بنیادی رجحان کی سمت کا تعین کریں۔
- زیادہ خرید اور زیادہ فروخت ہونے والے علاقوں کی نشاندہی کرنے کے لیے RSI (14 دن) کا استعمال کریں، 70 اور 30 کو کلیدی سطحوں کے طور پر ترتیب دیں۔
- رجحان کی مضبوطی اور ممکنہ موڑ کی تصدیق کے لیے MACD (12, 26, 9) کا استعمال کریں
- قیمت کے اتار چڑھاؤ اور ممکنہ الٹ پوائنٹس کی حد کا تعین کرنے کے لیے بولنگر بینڈز (20 دن، 2 معیاری انحراف) استعمال کریں۔
نظام مندرجہ ذیل شرائط کے تحت تجارتی سگنل تیار کرتا ہے:
- اہم خرید سگنل: قلیل مدتی MA طویل مدتی MA سے اوپر ہے۔
- اہم فروخت کا اشارہ: قلیل مدتی MA طویل مدتی MA سے نیچے ہے۔
- معاون خرید سگنل: RSI 30 سے نیچے ہے اور MACD ہسٹوگرام مثبت ہے اور قیمت بولنگر بینڈ کو چھوتی ہے
- معاون سیل سگنلز: RSI 70 سے اوپر ہے اور MACD ہسٹوگرام منفی ہے اور قیمت بالنگر بینڈ کو چھوتی ہے
اسٹریٹجک فوائد
- کثیر جہتی تجزیہ: متعدد تکنیکی اشاریوں کو یکجا کر کے، مارکیٹ کے تجزیہ کا ایک زیادہ جامع تناظر فراہم کیا جاتا ہے۔
- سگنل کی تصدیق کا طریقہ کار: اہم اور معاون سگنلز کا امتزاج غلط سگنلز کے اثرات کو کم کر سکتا ہے۔
- پرفیکٹ رسک کنٹرول: انٹری پوائنٹس کے خطرے کو کنٹرول کرنے کے لیے بولنگر بینڈز اور RSI کے امتزاج کا استعمال کریں
- رجحان سے باخبر رہنے کی اہلیت: MA اور MACD کے تعاون سے، ہم نہ صرف مرکزی رجحان کو سمجھ سکتے ہیں بلکہ رجحان کے اہم موڑ کی بھی نشاندہی کر سکتے ہیں۔
- مضبوط تصوراتی اثر: نظام ایک واضح گرافیکل انٹرفیس فراہم کرتا ہے، بشمول پس منظر کے رنگ کے اشارے اور شکل مارکر
اسٹریٹجک رسک
- سگنل ہسٹریسیس: حرکت پذیر اوسط میں خود ہی ہسٹریسس ہوتا ہے، جو سب سے بہترین انٹری پوائنٹ کا باعث بن سکتا ہے۔
- اتار چڑھاؤ والے بازار کا خطرہ: متواتر غلط سگنلز ایک طرف اور اتار چڑھاؤ والے بازار میں ہو سکتے ہیں
- متضاد اشارے: متعدد اشارے بعض اوقات میں متضاد اشارے پیدا کر سکتے ہیں۔
- پیرامیٹر کی حساسیت: حکمت عملی کا اثر پیرامیٹر کی ترتیب کے لیے حساس ہوتا ہے اور اس کے لیے کافی پیرامیٹر کی اصلاح کی ضرورت ہوتی ہے۔
حکمت عملی کی اصلاح کی سمت
- متحرک پیرامیٹر ایڈجسٹمنٹ: ہر اشارے کے پیرامیٹرز کو مارکیٹ کے اتار چڑھاؤ کے مطابق خود بخود ایڈجسٹ کیا جاسکتا ہے۔
- مارکیٹ کے ماحول کی درجہ بندی: مختلف مارکیٹ کے ماحول کے لیے شناخت کا طریقہ کار شامل کریں اور مختلف مارکیٹ کے حالات کے تحت مختلف سگنل کے امتزاج کا استعمال کریں
- بہتر سٹاپ نقصان کا طریقہ کار: مزید لچکدار سٹاپ نقصان کی اسکیمیں شامل کریں، جیسے ٹریلنگ سٹاپ نقصان یا ATR پر مبنی سٹاپ نقصان
- پوزیشن مینجمنٹ آپٹیمائزیشن: سگنل کی طاقت اور مارکیٹ کے اتار چڑھاؤ کی بنیاد پر پوزیشن کے سائز کو متحرک طور پر ایڈجسٹ کریں۔
- ٹائم فریم کوآرڈینیشن: سگنل کی وشوسنییتا کو بہتر بنانے کے لیے متعدد ٹائم فریم تجزیہ شامل کرنے پر غور کریں۔
خلاصہ کریں۔
یہ ایک اچھی طرح سے ڈیزائن کیا گیا کثیر جہتی تجارتی حکمت عملی کا نظام ہے جو متعدد تکنیکی اشارے کی ہم آہنگی کے ذریعے تجارتی سگنل فراہم کرتا ہے۔ حکمت عملی کے اہم فوائد اس کے جامع تجزیاتی فریم ورک اور سخت سگنل کی تصدیق کے طریقہ کار میں ہیں، لیکن پیرامیٹر کی اصلاح اور مارکیٹ کے ماحول کے مطابق موافقت جیسے مسائل پر توجہ دینا بھی ضروری ہے۔ تجویز کردہ اصلاحی ہدایات کے ذریعے، اس حکمت عملی میں اب بھی بہتری کی کافی گنجائش ہے۔
- 1