
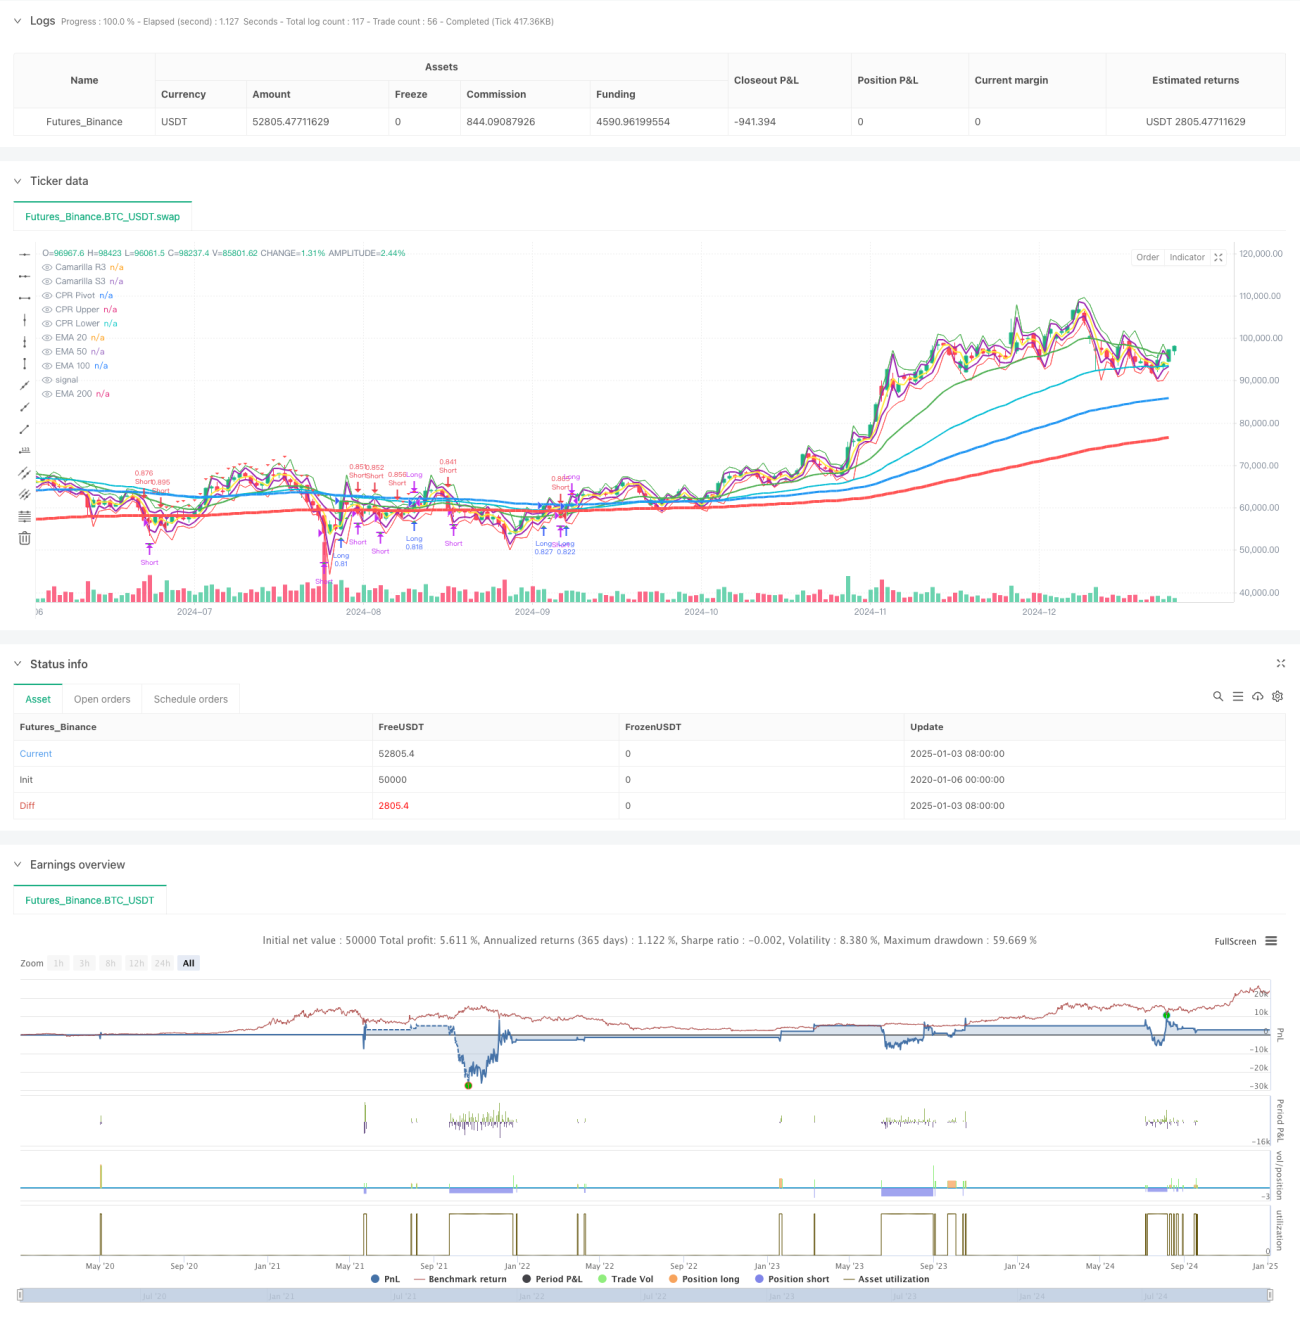
یہ حکمت عملی ٹریڈنگ سسٹم کے بعد ایک رجحان ہے جو ایک سے زیادہ ایکسپونینشل موونگ ایوریجز (EMA)، کیمریلا سپورٹ اور ریزسٹنس لیولز، اور سنٹرل پیوٹل رینج (CPR) کو یکجا کرتی ہے۔ حکمت عملی متعدد متحرک اوسطوں اور قیمت کی اہم حدود کے سلسلے میں قیمت کا تجزیہ کرکے مارکیٹ کے رجحانات اور ممکنہ تجارتی مواقع کی نشاندہی کرتی ہے۔ یہ نظام سخت فنڈ مینجمنٹ اور رسک کنٹرول کے اقدامات کو اپناتا ہے، بشمول فیصد پوزیشن کا سائز اور متنوع ایگزٹ میکانزم۔
حکمت عملی مندرجہ ذیل بنیادی اجزاء پر مبنی ہے:
یہ حکمت عملی متعدد کلاسک تکنیکی تجزیہ کے آلات کو مربوط کرکے ایک مکمل تجارتی نظام بناتی ہے۔ نظام کے فوائد کثیر جہتی مارکیٹ کے تجزیے اور سخت رسک مینجمنٹ میں ہیں، لیکن اسے مختلف مارکیٹ کے ماحول کے لیے اپنی موافقت پر بھی توجہ دینے کی ضرورت ہے۔ مسلسل اصلاح اور بہتری کے ذریعے، حکمت عملی سے توقع ہے کہ استحکام برقرار رکھتے ہوئے منافع میں بہتری آئے گی۔
/*backtest
start: 2020-01-06 00:00:00
end: 2025-01-04 08:00:00
period: 1d
basePeriod: 1d
exchanges: [{"eid":"Futures_Binance","currency":"BTC_USDT"}]
*/
//@version=5
strategy("Pradeep Crude oil Entry and Exit", overlay=true)
// Input settings for EMAs
ema20_period = input.int(20, title="EMA 20 Period")
ema50_period = input.int(50, title="EMA 50 Period")
ema100_period = input.int(100, title="EMA 100 Period")
ema200_period = input.int(200, title="EMA 200 Period")
// Fixed line width settings for EMAs
ema20_width = 2 // EMA 20 Line Width
ema50_width = 2 // EMA 50 Line Width
ema100_width = 3 // EMA 100 Line Width
ema200_width = 4 // EMA 200 Line Width
// Backtesting inputs
initial_capital = input.float(50000, title="Initial Capital", minval=100)
position_size_percent = input.float(100, title="Position Size (% of Capital)", minval=0.1, maxval=100)
exit_mode = input.string("Price Movement", title="Exit Mode", options=["Price Movement", "Percentage Movement"])
exit_points = input.int(20, title="Exit After X Points", minval=1)
exit_percentage = input.float(1.0, title="Exit After X% Movement", minval=0.1, step=0.1)
// Calculate EMAs
ema20 = ta.ema(close, ema20_period)
ema50 = ta.ema(close, ema50_period)
ema100 = ta.ema(close, ema100_period)
ema200 = ta.ema(close, ema200_period)
// Signal conditions
long_entry_condition = close > ema200 and close > ema20 and close[1] <= ema200
long_exit_condition = (exit_mode == "Price Movement" and close - strategy.position_avg_price >= exit_points * syminfo.mintick) or
(exit_mode == "Percentage Movement" and (close - strategy.position_avg_price) / strategy.position_avg_price * 100 >= exit_percentage)
short_entry_condition = close < ema200 and close < ema20 and close[1] >= ema200
short_exit_condition = (exit_mode == "Price Movement" and strategy.position_avg_price - close >= exit_points * syminfo.mintick) or
(exit_mode == "Percentage Movement" and (strategy.position_avg_price - close) / strategy.position_avg_price * 100 >= exit_percentage)
// Plot EMAs with specified line widths
plot(ema20, color=color.green, title="EMA 20", linewidth=ema20_width)
plot(ema50, color=color.aqua, title="EMA 50", linewidth=ema50_width)
plot(ema100, color=color.blue, title="EMA 100", linewidth=ema100_width)
plot(ema200, color=color.red, title="EMA 200", linewidth=ema200_width)
// Camarilla Pivot Calculation
prev_high = request.security(syminfo.tickerid, "D", high[1])
prev_low = request.security(syminfo.tickerid, "D", low[1])
prev_close = request.security(syminfo.tickerid, "D", close[1])
R3 = prev_close + (prev_high - prev_low) * 1.1 / 2
S3 = prev_close - (prev_high - prev_low) * 1.1 / 2
// Central Pivot Range (CPR) Calculation
pivot = (prev_high + prev_low + prev_close) / 3
upper_cpr = pivot + (prev_high - prev_low)
lower_cpr = pivot - (prev_high - prev_low)
// Plot Camarilla R3, S3 and CPR levels
plot(R3, color=color.purple, title="Camarilla R3", linewidth=2)
plot(S3, color=color.purple, title="Camarilla S3", linewidth=2)
plot(pivot, color=color.yellow, title="CPR Pivot", linewidth=2)
plot(upper_cpr, color=color.green, title="CPR Upper", linewidth=1)
plot(lower_cpr, color=color.red, title="CPR Lower", linewidth=1)
// Backtesting: Capital and position size
capital = initial_capital
risk_per_trade = (position_size_percent / 100) * capital
// Long positions
if long_entry_condition
strategy.entry("Long", strategy.long, qty=risk_per_trade / close)
// Display entry price label
label.new(bar_index, close, text="Entry: " + str.tostring(close), color=color.green, style=label.style_label_up, yloc=yloc.belowbar)
if long_exit_condition
strategy.close("Long")
// Display exit price label
label.new(bar_index, close, text="Exit: " + str.tostring(close), color=color.red, style=label.style_label_down, yloc=yloc.abovebar)
// Short positions
if short_entry_condition
strategy.entry("Short", strategy.short, qty=risk_per_trade / close)
// Display entry price label
label.new(bar_index, close, text="Entry: " + str.tostring(close), color=color.red, style=label.style_label_down, yloc=yloc.abovebar)
if short_exit_condition
strategy.close("Short")
// Display exit price label
label.new(bar_index, close, text="Exit: " + str.tostring(close), color=color.green, style=label.style_label_up, yloc=yloc.belowbar)
// Plot signals
plotshape(long_entry_condition, style=shape.triangleup, location=location.belowbar, color=color.new(color.green, 0), size=size.small, title="Long Entry")
plotshape(long_exit_condition, style=shape.triangledown, location=location.abovebar, color=color.new(color.red, 0), size=size.small, title="Long Exit")
plotshape(short_entry_condition, style=shape.triangledown, location=location.abovebar, color=color.new(color.red, 0), size=size.small, title="Short Entry")
plotshape(short_exit_condition, style=shape.triangleup, location=location.belowbar, color=color.new(color.green, 0), size=size.small, title="Short Exit")