ڈبل موونگ ایوریج کراس اوور ڈائنامک ٹرینڈ ٹریکنگ مقداری تجارتی حکمت عملی

جائزہ
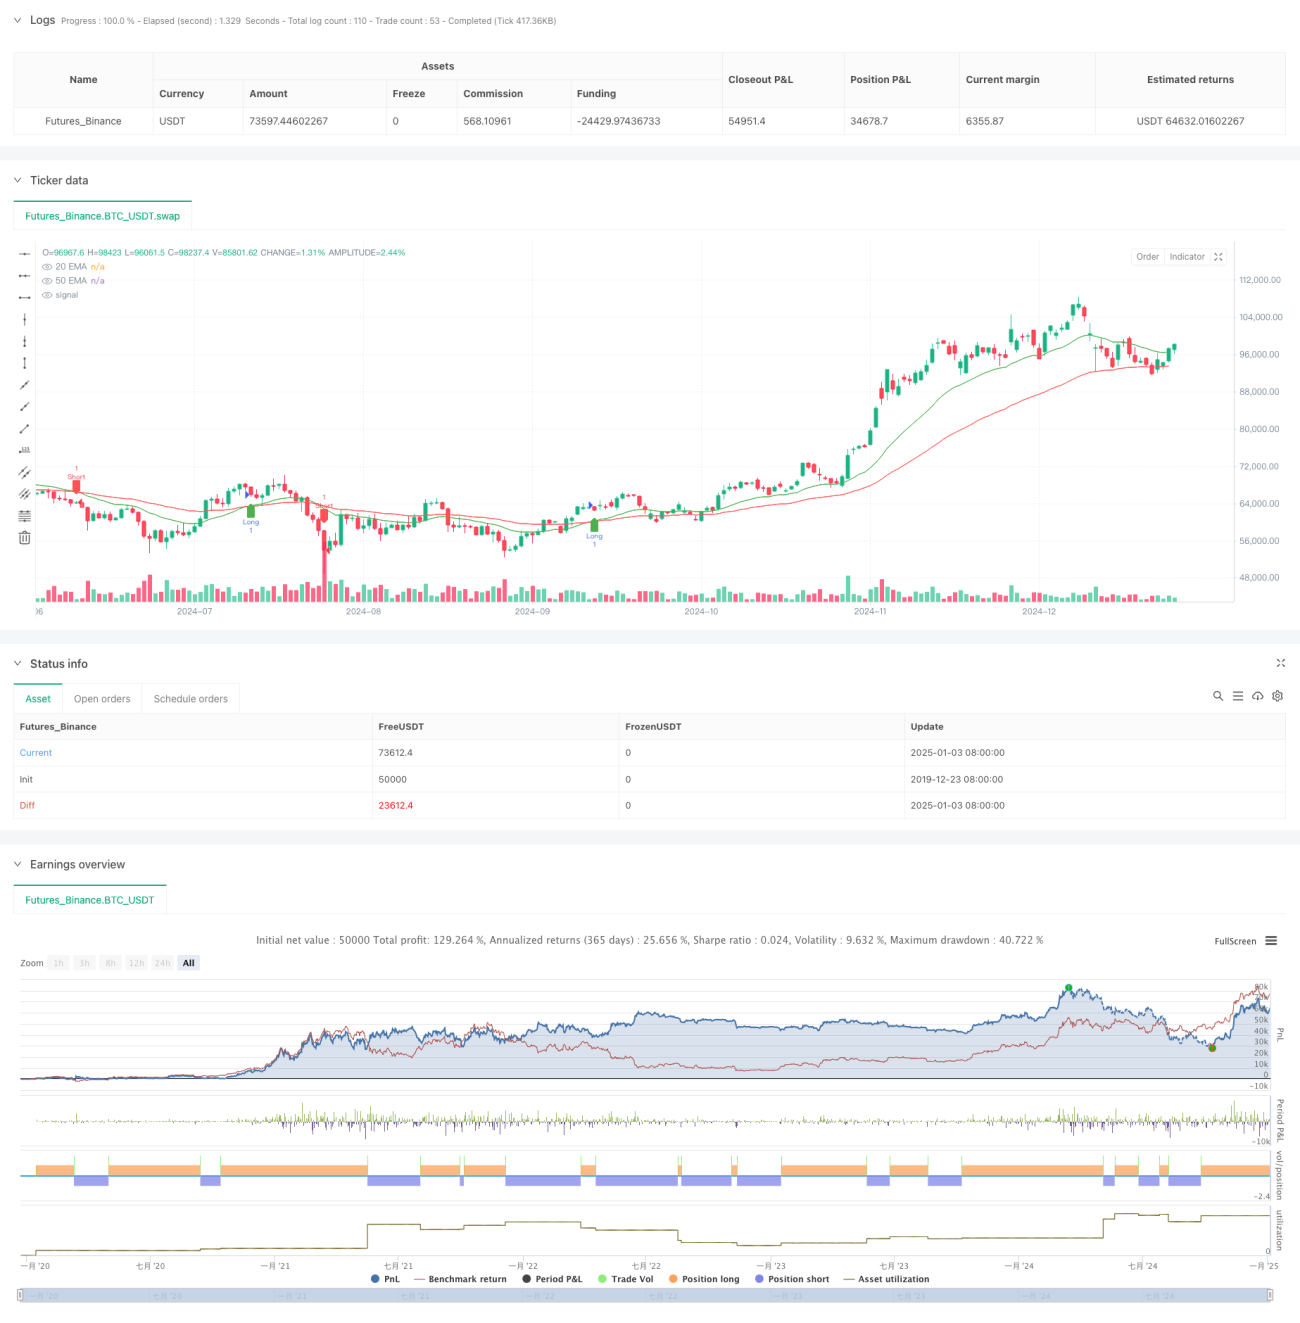
یہ حکمت عملی ڈبل موونگ ایوریج کراس اوور سگنلز پر مبنی ایک ڈائنامک ٹرینڈ ٹریکنگ سسٹم ہے جو قلیل مدتی 20 دن کے ایکسپونیشل موونگ ایوریج (EMA) اور طویل مدتی 50 دن کے ایکسپونیشل موونگ ایوریج کے ذریعے مارکیٹ کے رجحان کی تبدیلیوں کی نشاندہی کرتی ہے۔ EMA)، اور خود بخود خرید و فروخت کی کارروائیوں کو انجام دیتا ہے۔ حکمت عملی ایک بالغ تکنیکی تجزیہ کا طریقہ اپناتی ہے، جو رجحان سے باخبر رہنے اور متحرک پوزیشن مینجمنٹ کی خصوصیات کو یکجا کرتی ہے، اور زیادہ اتار چڑھاؤ کے ساتھ مارکیٹ کے ماحول کے لیے موزوں ہے۔
حکمت عملی کا اصول
حکمت عملی کی بنیادی منطق درج ذیل کلیدی عناصر پر مبنی ہے:
- رجحان کے اشارے کے طور پر 20-دن اور 50-دن کے ایکسپونینشل موونگ ایوریجز (EMA) کا استعمال کریں
- جب قلیل مدتی 20 دن کی EMA طویل مدتی 50 دن کی EMA کو اوپر کی طرف کراس کرتی ہے، تو نظام ایک طویل سگنل پیدا کرتا ہے۔
- جب قلیل مدتی 20-دن کی EMA طویل مدتی 50-دن کی EMA کو نیچے کی طرف کراس کرتی ہے، تو نظام ایک مختصر سگنل پیدا کرتا ہے۔
- پوزیشن مینجمنٹ کی درستگی کو یقینی بنانے کے لیے پوزیشن متغیرات کے ذریعے متحرک طور پر پوزیشن کی حیثیت کو ٹریک کریں۔
- جب کراس اوور سگنل ظاہر ہوتا ہے، نظام خود بخود موجودہ پوزیشنز کو بند کر دیتا ہے اور نئی پوزیشنز کھولتا ہے۔
اسٹریٹجک فوائد
- مضبوط سگنل کی وضاحت: متحرک اوسط کراس اوور پر مبنی سگنل کے فیصلے کا طریقہ کار آسان اور بدیہی ہے، اور غلط سگنل پیدا کرنا آسان نہیں ہے۔
- کامل رسک کنٹرول سسٹم: متحرک پوزیشن مینجمنٹ میکانزم کو اپنانا، یہ مارکیٹ کی تبدیلیوں کا بروقت جواب دے سکتا ہے۔
- وسیع موافقت: حکمت عملیوں کا اطلاق مختلف مارکیٹ کے ماحول اور تجارتی مصنوعات پر کیا جا سکتا ہے۔
- اعلی کارکردگی کی کارکردگی: پروگرام ٹریڈنگ سگنل پیدا ہونے کے بعد تیزی سے عملدرآمد کو یقینی بناتا ہے
- بیک ٹیسٹنگ کی سہولت: ایک مکمل بیک ٹیسٹنگ فریم ورک بنایا گیا ہے تاکہ حکمت عملی کی اصلاح اور تصدیق کی سہولت فراہم کی جا سکے۔
اسٹریٹجک رسک
- اتار چڑھاؤ والے بازار کا خطرہ: غلط بریک آؤٹ سگنل سائیڈ وے مارکیٹ میں اکثر ہو سکتے ہیں۔
- پھسلنے کا خطرہ: جب مارکیٹ میں پرتشدد اتار چڑھاؤ آتا ہے تو آپ کو بڑے لین دین کے پھسلن کا سامنا کرنا پڑ سکتا ہے۔
- تاخیر کا خطرہ: EMA اشارے میں خود ایک خاص وقفہ ہوتا ہے، جس کی وجہ سے داخلے کا سب سے زیادہ نقطہ ہو سکتا ہے۔
- فنڈ مینجمنٹ کا خطرہ: حکمت عملی سٹاپ نقصان اور فنڈ کے انتظام کے طریقہ کار کو متعین نہیں کرتی ہے، جسے بہتر کرنے کی ضرورت ہے۔
- منظم خطرہ: جب مارکیٹ میں پرتشدد اتار چڑھاؤ آتا ہے تو آپ کو نظامی خطرے کا سامنا کرنا پڑ سکتا ہے۔
حکمت عملی کی اصلاح کی سمت
- اتار چڑھاؤ والے بازاروں میں غلط سگنلز کو کم کرنے کے لیے اتار چڑھاؤ کے فلٹرز متعارف کرائے جا رہے ہیں۔
- فنڈ سیکیورٹی کو بہتر بنانے کے لیے انکولی اسٹاپ لاس اور اسٹاپ پرافٹ میکانزم شامل کریں۔
- مختلف مارکیٹ کے ماحول سے بہتر طور پر موافقت کے لیے متحرک اوسط مدت کے پیرامیٹرز کو بہتر بنائیں
- سگنل کی وشوسنییتا کو بہتر بنانے کے لیے حجم کی تصدیق کا طریقہ کار شامل کریں۔
- سرمائے کے استعمال کی کارکردگی کو بہتر بنانے کے لیے ایک متحرک پوزیشن مینجمنٹ سسٹم متعارف کروائیں۔
خلاصہ کریں۔
یہ حکمت عملی ایک کلاسک ٹرینڈ ٹریکنگ سسٹم کا جدید نفاذ ہے جس میں پروگرامیٹک ٹریڈنگ کے ذریعے روایتی ڈبل موونگ ایوریج کراس اوور کی حکمت عملی کو منظم اور معیاری بنایا گیا ہے۔ اگرچہ کچھ موروثی خطرات ہیں، لیکن مسلسل اصلاح اور بہتری کے ذریعے حکمت عملی کے اچھے اطلاق کے امکانات ہیں۔ حقیقی استعمال سے پہلے کافی پیرامیٹر کی اصلاح اور بیک ٹیسٹنگ کی تصدیق کرنے کی سفارش کی جاتی ہے۔
- 1