
جائزہ
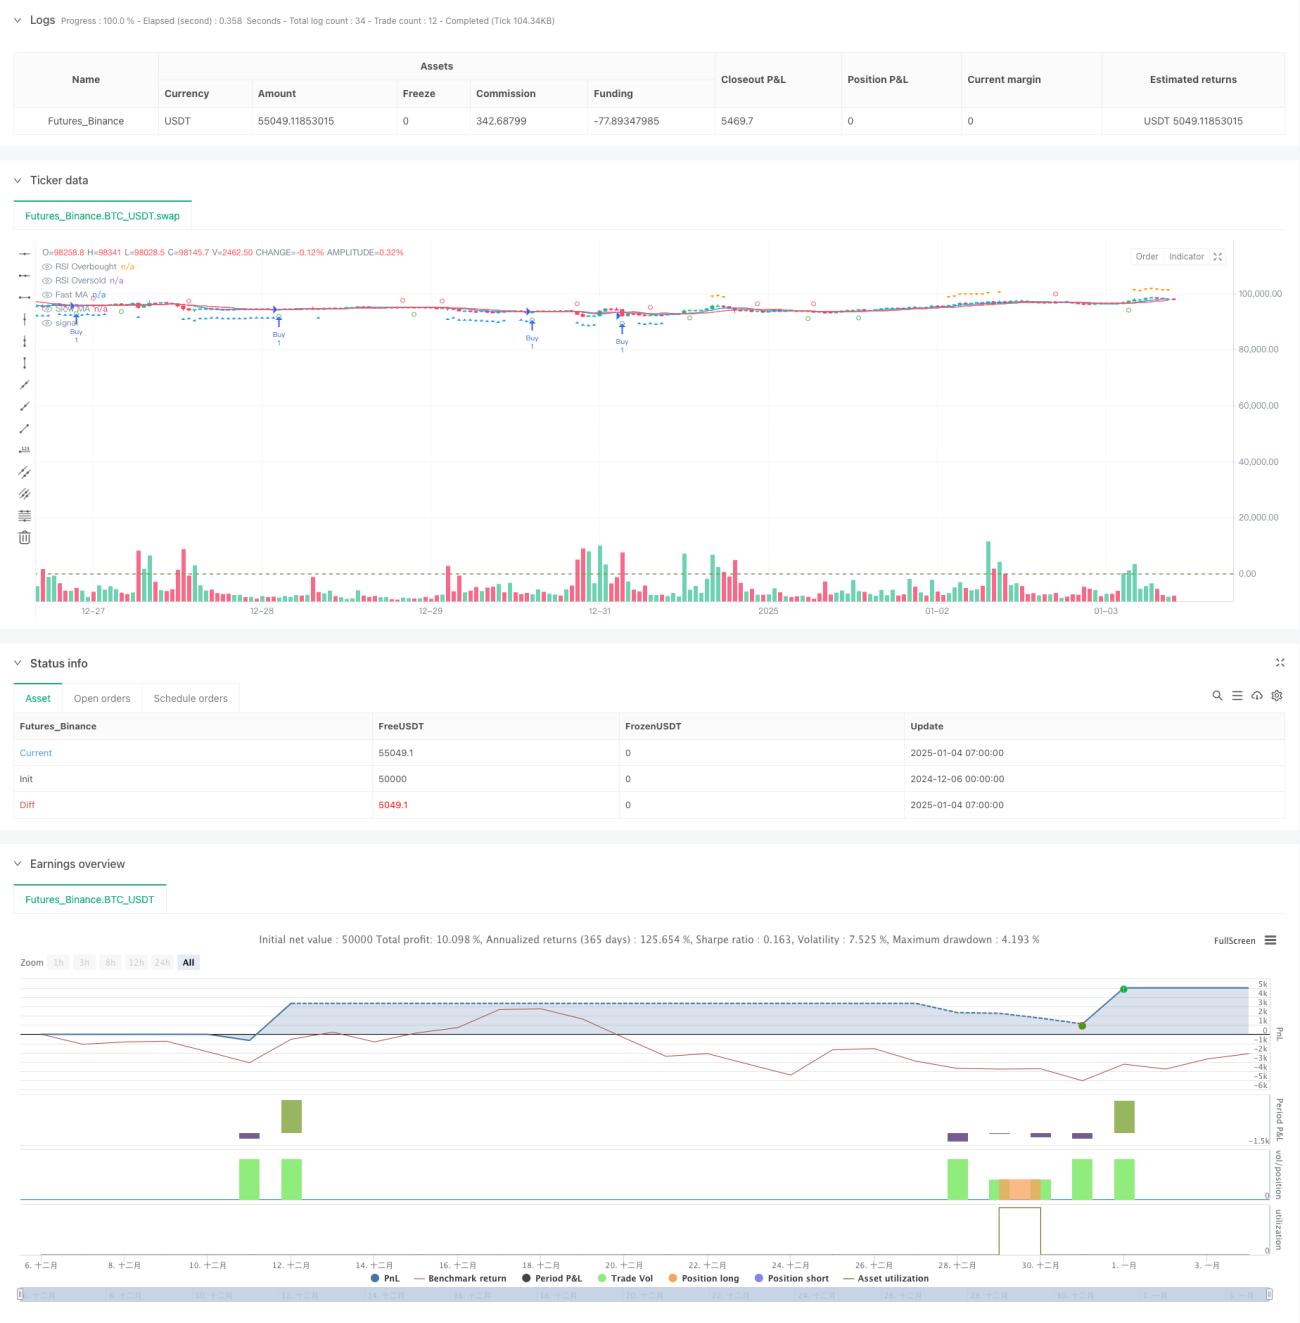
یہ حکمت عملی ایک مقداری تجارتی نظام ہے جس کی بنیاد موونگ ایوریج کراس اوور اور RSI انڈیکیٹرز پر ہے، جو بنیادی طور پر آپشنز مارکیٹ میں ٹریڈنگ کے لیے استعمال ہوتی ہے۔ یہ حکمت عملی تیز رفتار اور سست حرکت اوسط کے کراس اوور سگنلز کا استعمال کرتی ہے، RSI اووربوٹ اور اوور سیلڈ لیولز کے ساتھ مل کر لین دین کے وقت کا تعین کرتی ہے، جبکہ خطرات کو کنٹرول کرنے کے لیے ٹیک پرافٹ اور اسٹاپ لاس سیٹ کرتی ہے۔ یہ حکمت عملی 5 منٹ کے ٹائم فریم پر ٹریڈنگ کے لیے موزوں ہے۔
حکمت عملی کا اصول
حکمت عملی میں دو اہم تکنیکی اشارے استعمال کیے گئے ہیں: موونگ ایوریج (MA) اور رشتہ دار طاقت انڈیکس (RSI)۔ خاص طور پر:
- قیمت کے رجحانات کو پکڑنے کے لیے 7 مدت اور 13 مدت کی سادہ حرکت پذیری اوسط (SMAs) کا استعمال کریں
- زائد خریدی اور زیادہ فروخت شدہ حالات کی نشاندہی کرنے کے لیے 17 مدت کے RSI اشارے کا استعمال
- جب تیز چلنے والی اوسط آہستہ حرکت کرنے والی اوسط کو اوپر کی طرف کراس کرتی ہے اور RSI 43 سے نیچے ہوتا ہے، تو نظام ایک لمبا سگنل پیدا کرتا ہے۔
- جب تیز چلنے والی اوسط نیچے کی طرف سست حرکت کرنے والے اوسط کو عبور کرتی ہے اور RSI 64 سے اوپر ہوتی ہے، تو نظام ایک مختصر سگنل پیدا کرتا ہے۔
- خطرے کا انتظام کرنے کے لیے 4% ٹیک پرافٹ اور 0.5% سٹاپ نقصان مقرر کریں۔
اسٹریٹجک فوائد
- ایک سے زیادہ تصدیقی طریقہ کار: زیادہ قابل اعتماد تجارتی سگنل فراہم کرنے کے لیے متحرک اوسط کراس اوور اور RSI اشارے کو یکجا کریں
- پرفیکٹ رسک مینجمنٹ: مؤثر طریقے سے خطرات کو کنٹرول کرنے کے لیے اسٹاپ پرافٹ اور اسٹاپ لاس کا ایک مقررہ فیصد مقرر کریں۔
- مضبوط موافقت: پیرامیٹرز کو مارکیٹ کے مختلف حالات کے مطابق لچکدار طریقے سے ایڈجسٹ کیا جا سکتا ہے۔
- ویژولائزیشن سپورٹ: حکمت عملی واضح گرافیکل ہدایات فراہم کرتی ہے تاکہ تاجروں کو مارکیٹ کے حالات کو سمجھنے میں سہولت فراہم کی جا سکے۔
- آپریٹنگ اصولوں کو صاف کریں: داخلے اور باہر نکلنے کے حالات صاف کریں، ساپیکش فیصلے کی وجہ سے مداخلت کو کم کریں
اسٹریٹجک رسک
- اتار چڑھاؤ والے بازار کا خطرہ: متواتر غلط سگنلز ایک طرف اور اتار چڑھاؤ والے بازار میں ہو سکتے ہیں
- پھسلنے کا خطرہ: جب آپشنز کی مارکیٹ غیر قانونی ہوتی ہے، تو آپ کو بڑی پھسلن کا سامنا کرنا پڑ سکتا ہے۔
- پیرامیٹر کی حساسیت: حکمت عملی کا اثر پیرامیٹر کی ترتیبات کے لیے حساس ہے اور اسے مسلسل بہتر بنانے کی ضرورت ہے۔
- مارکیٹ کے ماحول پر انحصار: مارکیٹ کے غیر مستحکم ماحول میں، سٹاپ نقصان کافی وقت پر نہیں ہو سکتا
- نظامی خطرہ: جب مارکیٹ میں فرق یا بڑے واقعات رونما ہوتے ہیں، تو سٹاپ نقصان ناکام ہو سکتا ہے۔
حکمت عملی کی اصلاح کی سمت
- اتار چڑھاؤ کے اشاریوں کا تعارف: اپنے فیصلہ سازی کے نظام میں اے ٹی آر یا بولنگر بینڈز کو شامل کرنے پر غور کریں۔
- پیرامیٹر موافقت کو بہتر بنائیں: مارکیٹ کے حالات کی بنیاد پر ایک متحرک پیرامیٹر ایڈجسٹمنٹ میکانزم تیار کریں
- مارکیٹ کے جذبات کی فلٹرنگ میں اضافہ کریں: غلط سگنلز کو فلٹر کرنے کے لیے تجارتی حجم اور دیگر اشاریوں کو یکجا کریں۔
- سٹاپ نقصان کے طریقہ کار کو بہتر بنائیں: رسک مینجمنٹ کی کارکردگی کو بہتر بنانے کے لیے ٹریلنگ سٹاپ نقصان متعارف کرانے پر غور کریں
- ٹائم فلٹر شامل کریں: غیر موثر ٹریڈنگ سے بچنے کے لیے ٹریڈنگ ٹائم ونڈو کی حد شامل کریں۔
خلاصہ کریں۔
یہ حکمت عملی متحرک اوسط کراس اوور اور RSI اشارے کو ملا کر ایک نسبتاً مکمل تجارتی نظام تشکیل دیتی ہے۔ حکمت عملی کے فوائد ایک سے زیادہ سگنل کی تصدیق اور کامل رسک مینجمنٹ میں ہیں، لیکن حکمت عملی کی کارکردگی پر مارکیٹ کے ماحول کے اثرات پر بھی توجہ دینا ضروری ہے۔ مسلسل اصلاح اور بہتری کے ذریعے، اس حکمت عملی سے آپشنز مارکیٹ میں مستحکم کارکردگی حاصل کرنے کی امید ہے۔ یہ سفارش کی جاتی ہے کہ تاجر حقیقی وقت کے استعمال سے پہلے کافی بیک ٹیسٹنگ اور پیرامیٹر کی اصلاح کریں۔
- 1