خطرے کے انتظام کے نظام کے ساتھ مل کر دوہری تکنیکی اشارے مومینٹم ریورسل ٹریڈنگ حکمت عملی

جائزہ
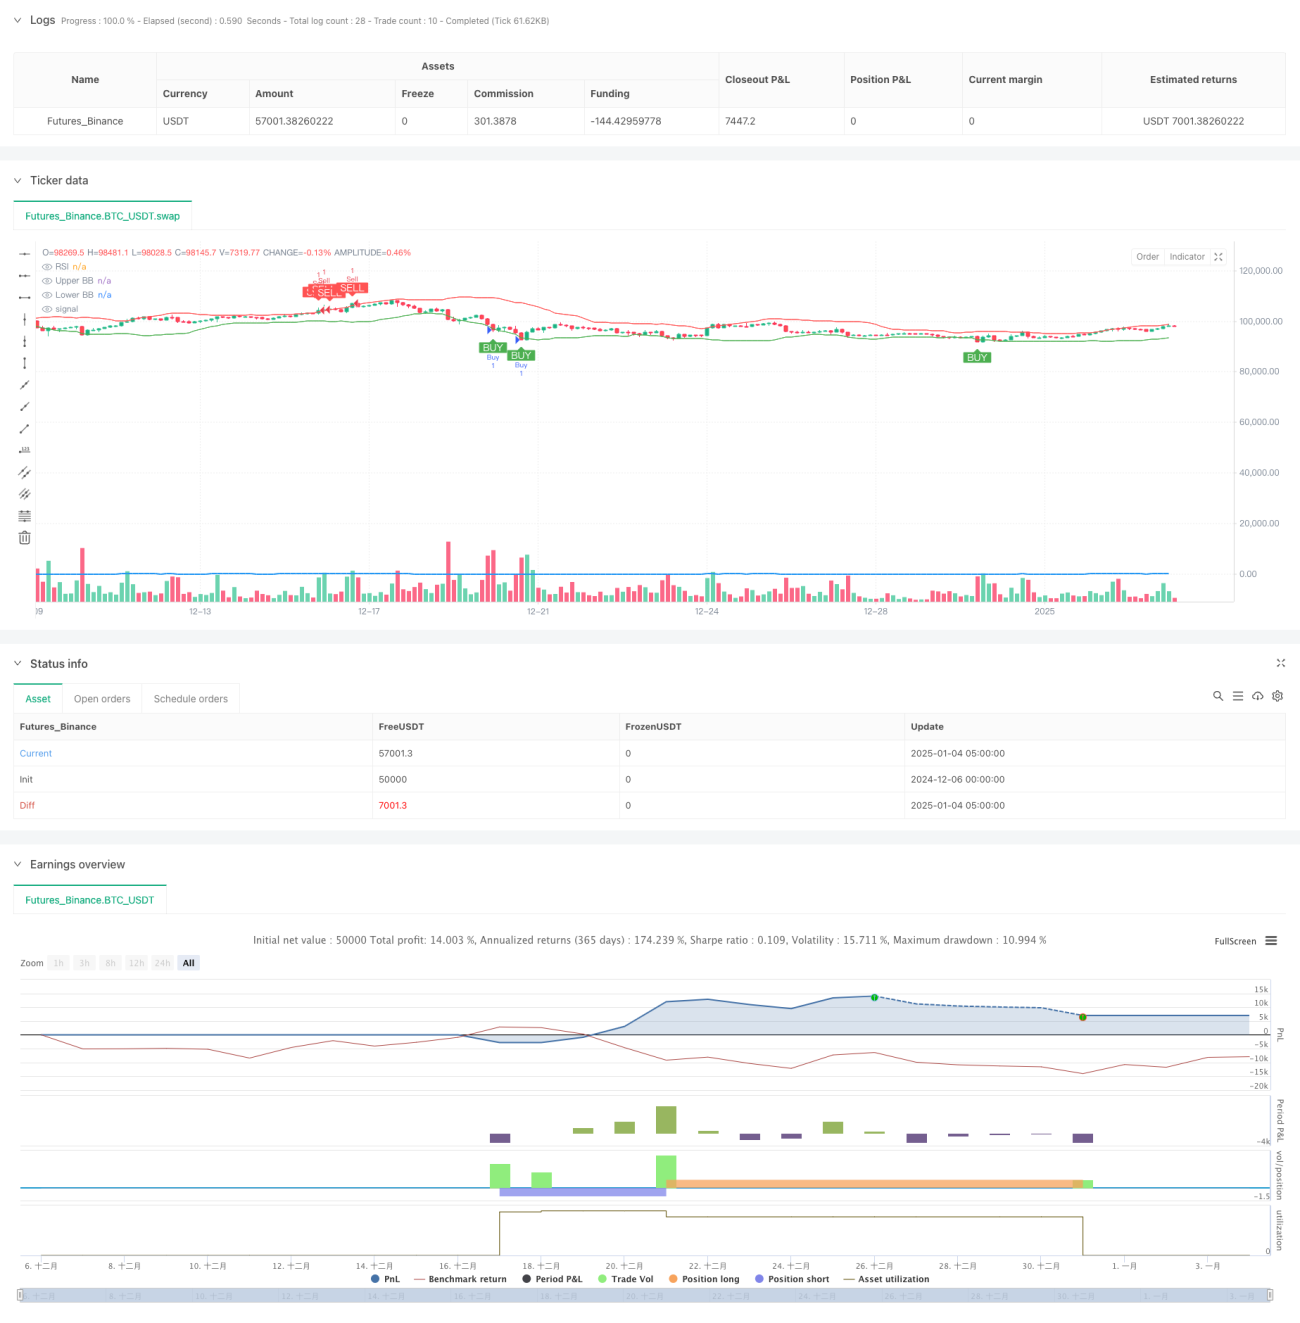
یہ حکمت عملی ایک مومینٹم ریورسل ٹریڈنگ سسٹم ہے جو RSI اور بولنگر بینڈز کے دوہری تکنیکی اشاریوں کو جوڑ کر تجارت کے لیے زیادہ خریدے اور زیادہ فروخت شدہ علاقوں کی نشاندہی کرتا ہے۔ حکمت عملی 1:2 رسک ریٹرن ریشو کا استعمال کرتی ہے اور رسک کنٹرول کے لیے موونگ اسٹاپ نقصان کو یکجا کرتی ہے۔ بنیادی منطق اس وقت تجارت کرنا ہے جب RSI اور بولنگر بینڈز ایک ہی وقت میں زیادہ خرید یا زیادہ فروخت ہونے والے سگنل دکھاتے ہیں، اور سخت رسک مینجمنٹ کے ذریعے فنڈز کی حفاظت کرتے ہیں۔
حکمت عملی کا اصول
حکمت عملی 14 مدت کے RSI اور 20 مدت کے بولنگر بینڈز کو اہم اشارے کے طور پر استعمال کرتی ہے۔ خریداری کی شرائط کو ایک ساتھ پورا کرنا ضروری ہے: RSI 30 سے کم ہے (زیادہ فروخت) اور قیمت نچلے بولنگر بینڈ کو چھوتی ہے یا نیچے آتی ہے۔ فروخت کی شرائط کو ایک ہی وقت میں پورا کرنا ضروری ہے: RSI 70 سے اوپر ہے (زیادہ خریدی گئی) اور قیمت بالنگر بینڈ کو چھوتی ہے یا اس سے زیادہ ہے۔ یہ نظام 5 K-لائنز کے سب سے زیادہ/کم ترین پوائنٹ کو موونگ سٹاپ نقصان کے طور پر استعمال کرتا ہے، اور ٹیک-پرافٹ پوزیشن سٹاپ نقصان کے فاصلے سے دوگنا ہے، 1:2 رسک ریٹرن ریشو کو سختی سے نافذ کرتا ہے۔
اسٹریٹجک فوائد
- ڈوئل ٹیکنیکل انڈیکس فلٹرنگ سگنل کے معیار کو بہتر بناتا ہے اور غلط سگنلز کو کم کرتا ہے۔
- مارکیٹ کا زیادہ جامع نقطہ نظر فراہم کرنے کے لیے رفتار اور اتار چڑھاؤ کے اشارے کو یکجا کرنا
- رسک کنٹرول کا سخت طریقہ کار، بشمول ٹریلنگ اسٹاپ نقصان اور مقررہ رسک ریٹرن ریشو
- نظام مکمل طور پر خودکار ہے، انسانی جذباتی مداخلت کو ختم کرتا ہے۔
- حکمت عملی کی منطق واضح، سمجھنے اور برقرار رکھنے میں آسان ہے۔
اسٹریٹجک رسک
- سٹاپ نقصانات رجحان ساز بازاروں میں اکثر ہو سکتے ہیں۔
- دوہرے حالات کچھ تجارتی مواقع سے محروم ہو سکتے ہیں۔
- فکسڈ RSI اور بولنگر بینڈ پیرامیٹرز مارکیٹ کے تمام ماحول کے لیے موزوں نہیں ہو سکتے
- پیچھے ہٹنا غیر مستحکم مارکیٹوں میں قبل از وقت اخراج کا باعث بن سکتا ہے۔
- مسلسل نقصانات سے نمٹنے کے لیے معقول رقم کے انتظام کی ضرورت ہے۔
حکمت عملی کی اصلاح کی سمت
- مارکیٹ کے اتار چڑھاؤ کے مطابق اشارے کے پیرامیٹرز کو متحرک طور پر ایڈجسٹ کرنے کے لیے ایک انکولی پیرامیٹر میکانزم متعارف کروائیں
- مضبوط رجحانات میں ریورسل ٹریڈنگ کو معطل کرنے کے لیے ٹرینڈ فلٹر شامل کیا گیا۔
- ایک متحرک رسک ریٹرن ریشو سسٹم تیار کریں اور اسے مارکیٹ کے حالات کے مطابق ایڈجسٹ کریں۔
- سگنل کی وشوسنییتا کو بہتر بنانے کے لیے حجم کی تصدیق کا طریقہ کار شامل کریں۔
- مزید لچکدار سٹاپ نقصان کے طریقہ کار کو لاگو کریں، جیسے ٹریلنگ سٹاپ نقصان یا ٹائم سٹاپ نقصان
خلاصہ کریں۔
یہ ایک اچھی طرح سے تشکیل شدہ ریورسل ٹریڈنگ حکمت عملی ہے جو زیادہ درستگی کے لیے دوہری تکنیکی اشارے استعمال کرتی ہے اور سخت رسک مینجمنٹ کو ملازمت دیتی ہے۔ اگرچہ حکمت عملی سادہ اور بدیہی ہے، لیکن اس میں ایک بالغ تجارتی نظام کے لیے درکار کلیدی عناصر شامل ہیں۔ تجویز کردہ اصلاحی ہدایات کے ذریعے، اس حکمت عملی میں مزید بہتری کی گنجائش ہے۔ حقیقی تجارت میں، پہلے کافی بیک ٹیسٹنگ اور پیرامیٹر کی اصلاح کرنے کی سفارش کی جاتی ہے۔
- 1