طویل مدتی رجحان SMA حرکت پذیر اوسط کراس اوور مقداری حکمت عملی

جائزہ
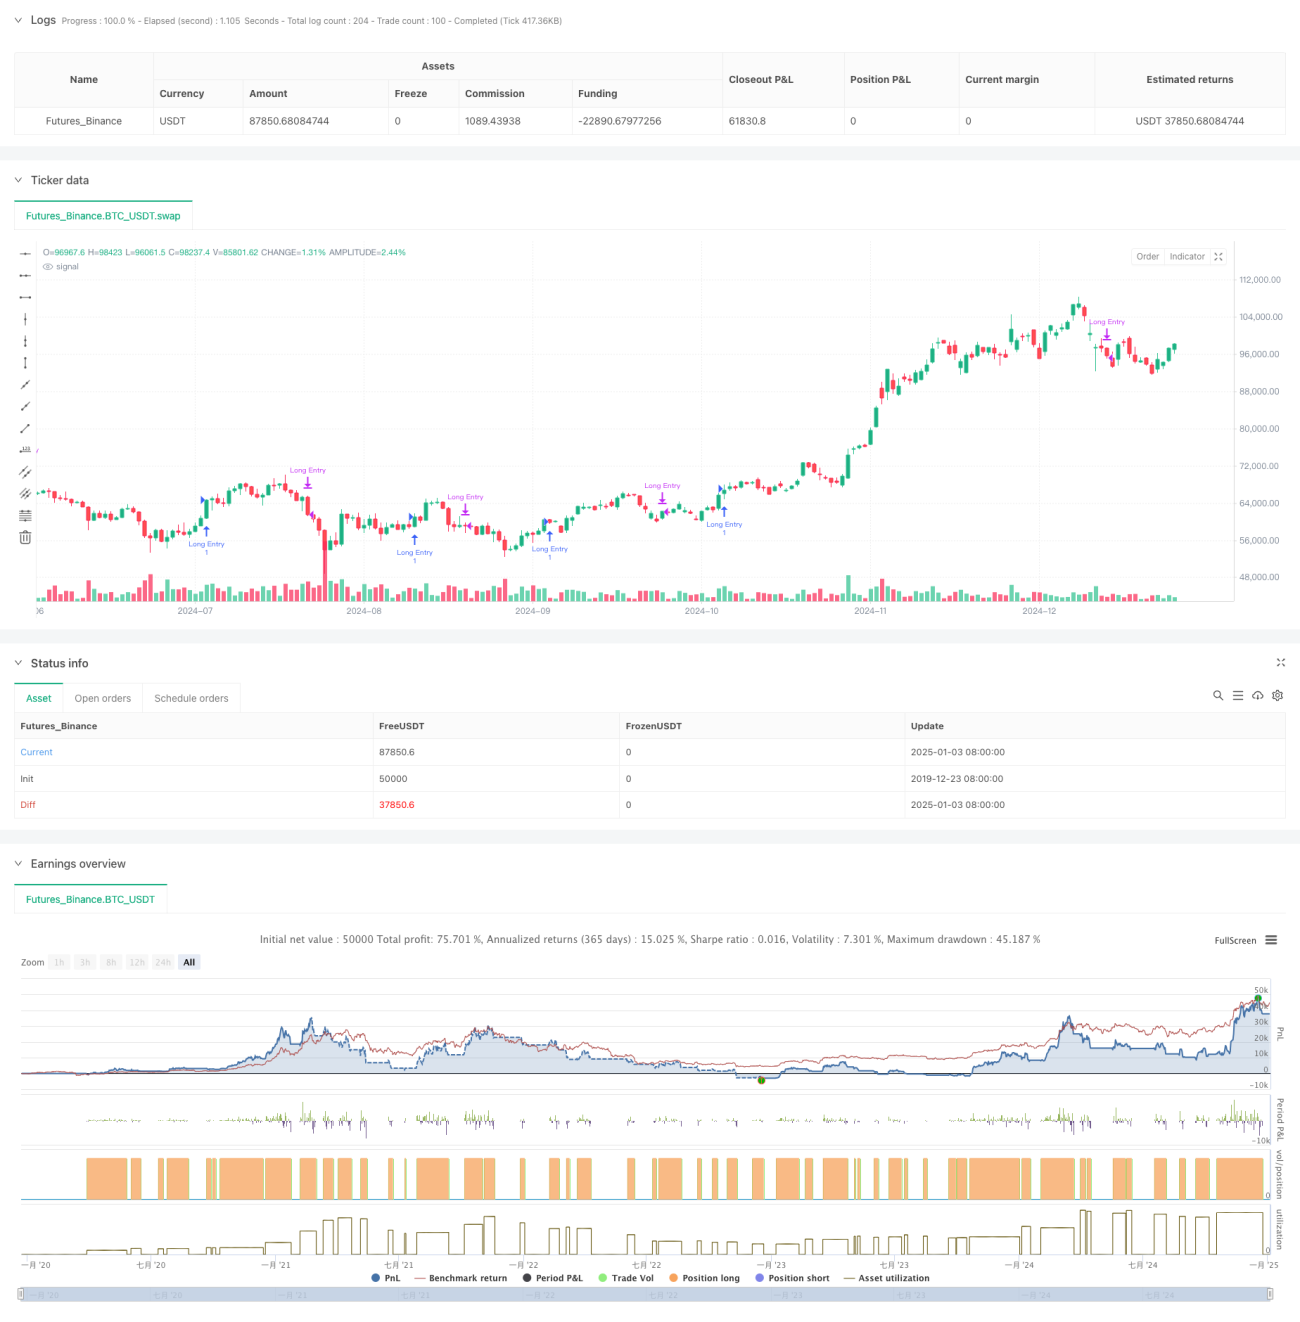
حکمت عملی ایک مقداری تجارتی نظام ہے جس کی بنیاد ملٹی پیریڈ سادہ موونگ ایوریج (SMA) کراس اوور سگنلز پر ہوتی ہے۔ یہ بنیادی طور پر طویل مدتی اپ ٹرینڈ کے اندر قلیل مدتی پل بیک کے مواقع کی نشاندہی کرکے تجارت کرتا ہے۔ یہ حکمت عملی 5 دن، 10 دن، 20 دن، 60 دن اور 120 دن کے پانچ ادوار کے ساتھ SMA اشاریوں کا استعمال کرتی ہے تاکہ مارکیٹ کے رجحانات اور تجارتی مواقع کو پوزیشن کے رشتے اور متحرک اوسط کے کراس اوور سگنلز کے ذریعے اندازہ کیا جا سکے۔
حکمت عملی کا اصول
حکمت عملی کی بنیادی منطق میں درج ذیل اہم حصے شامل ہیں:
- طویل مدتی رجحان کا اندازہ SMA20 اور SMA60 کے درمیان رشتہ داری سے لگایا جا سکتا ہے جب SMA20 SMA60 سے اوپر ہوتا ہے، اس بات کی تصدیق ہوتی ہے کہ مارکیٹ اوپر کی طرف ہے۔
- طویل مدتی اپ ٹرینڈ کی تصدیق کی بنیاد پر، جب قلیل مدتی SMA5 SMA20 کے نیچے سے اوپر کی طرف ریباؤنڈ کرتا ہے تو خریداری کا سگنل شروع ہوتا ہے۔ اس سے پتہ چلتا ہے کہ اپ ٹرینڈ میں قلیل مدتی پل بیک کے بعد مارکیٹ دوبارہ بحال ہو رہی ہے۔
- جب SMA20 SMA5 کو کراس کرتا ہے، تو ایک بند ہونے والا سگنل متحرک ہو جاتا ہے۔ اس سے ظاہر ہوتا ہے کہ قلیل مدتی اوپر کی رفتار کمزور ہو گئی ہے اور ایڈجسٹمنٹ کی مدت میں داخل ہو سکتی ہے۔
- حکمت عملی میں ٹائم فلٹر فنکشن بھی شامل ہے، جو بیک ٹیسٹ کے وقت کی حد کو محدود کر سکتا ہے اور حکمت عملی کی لچک کو بڑھا سکتا ہے۔
اسٹریٹجک فوائد
- حکمت عملی کی منطق واضح اور سادہ ہے، سمجھنے اور لاگو کرنے میں آسان ہے، اور اس میں حساب کے پیچیدہ عمل شامل نہیں ہیں۔
- کوآرڈینیشن میں ایک سے زیادہ دورانیے کی موونگ ایوریجز کا استعمال کرتے ہوئے، ہم مارکیٹ کے شور کو مؤثر طریقے سے فلٹر کر سکتے ہیں اور تجارتی سگنلز کی وشوسنییتا کو بہتر بنا سکتے ہیں۔
- حکمت عملی رجحان ساز بازاروں میں پل بیک کے مواقع پر توجہ مرکوز کرتی ہے، جو کہ "ٹرینڈ ٹریڈنگ" کے بنیادی تصور کے مطابق ہے۔
- EMA کے بجائے SMA استعمال کرنے سے قیمتوں میں تبدیلی کی حساسیت کم ہوتی ہے اور غلط سگنلز کم ہوتے ہیں۔
- داخلے اور باہر نکلنے کی منطق واضح ہے، جو عمل درآمد اور رسک کنٹرول میں سہولت فراہم کرتی ہے۔
اسٹریٹجک رسک
- موونگ ایوریج سسٹم میں وقفہ ہوتا ہے، جس کی وجہ سے داخلے اور باہر نکلنے کا وقت سب سے زیادہ ہو سکتا ہے۔
- ایک غیر مستحکم مارکیٹ میں، متواتر حرکت پذیر اوسط کراس اوور بہت زیادہ غلط سگنل پیدا کر سکتے ہیں۔
- اس حکمت عملی میں اتار چڑھاؤ کو فلٹر کرنے کے طریقہ کار کی کمی ہے اور زیادہ اتار چڑھاؤ کے ادوار کے دوران اسے ڈرا ڈاون کے زیادہ خطرات کا سامنا کرنا پڑ سکتا ہے۔
- تجارتی حجم جیسے دیگر تکنیکی اشارے کے تعاون پر غور کیے بغیر، سگنل کی وشوسنییتا کو بہتر بنانے کی ضرورت ہے۔
- ہو سکتا ہے فکسڈ موونگ ایوریج پیرامیٹرز مارکیٹ کے تمام ماحول کے لیے موزوں نہ ہوں۔
حکمت عملی کی اصلاح کی سمت
- اتار چڑھاؤ کی فلٹرنگ کے لیے ATR انڈیکیٹر متعارف کروائیں اور جب اتار چڑھاؤ بہت زیادہ ہو تو تجارت سے گریز کریں۔
- تجارتی سگنلز کی وشوسنییتا کو بہتر بنانے کے لیے حجم کی تصدیق کا طریقہ کار شامل کریں۔
- حکمت عملی کو مختلف مارکیٹ کے ماحول میں بہتر طریقے سے ڈھالنے کے قابل بنانے کے لیے ایک انکولی حرکت پذیر اوسط سائیکل میکانزم تیار کریں۔
- مضبوط رجحانات میں ٹریڈنگ کو یقینی بنانے کے لیے ٹرینڈ سٹرینتھ فلٹر، جیسے ADX انڈیکیٹر شامل کریں۔
- خطرات کو بہتر طور پر کنٹرول کرنے کے لیے سٹاپ لاس کے طریقہ کار کو بہتر بنائیں، جیسے کہ ٹریلنگ سٹاپ کو شامل کرنا۔
خلاصہ کریں۔
یہ حکمت عملی ایک تجارتی نظام بنانے کے لیے کثیر مدتی SMA موونگ ایوریجز کا استعمال کرتی ہے جو طویل مدتی اوپر کے رجحانات میں پل بیک کے مواقع حاصل کرنے پر توجہ مرکوز کرتی ہے۔ حکمت عملی کا ڈیزائن جامع اور عملی ہے، اچھی سمجھ اور قابل عمل ہے۔ اتار چڑھاؤ کی فلٹرنگ اور حجم کی تصدیق جیسے اصلاحی اقدامات متعارف کرانے سے، حکمت عملی کی مضبوطی اور وشوسنییتا میں مزید بہتری کی توقع ہے۔
/*backtest
start: 2019-12-23 08:00:00
end: 2025-01-04 08:00:00
period: 1d
basePeriod: 1d
exchanges: [{"eid":"Futures_Binance","currency":"BTC_USDT"}]
*/

//@version=6
strategy("Long-Term Growing Stock Strategy", overlay=true)
// Date Range
// STEP 1. Create inputs that configure the backtest's date range- 1