RSI اتار چڑھاؤ کی حکمت عملی کے بعد متعدد متحرک اوسط کراس اوور رجحان

جائزہ
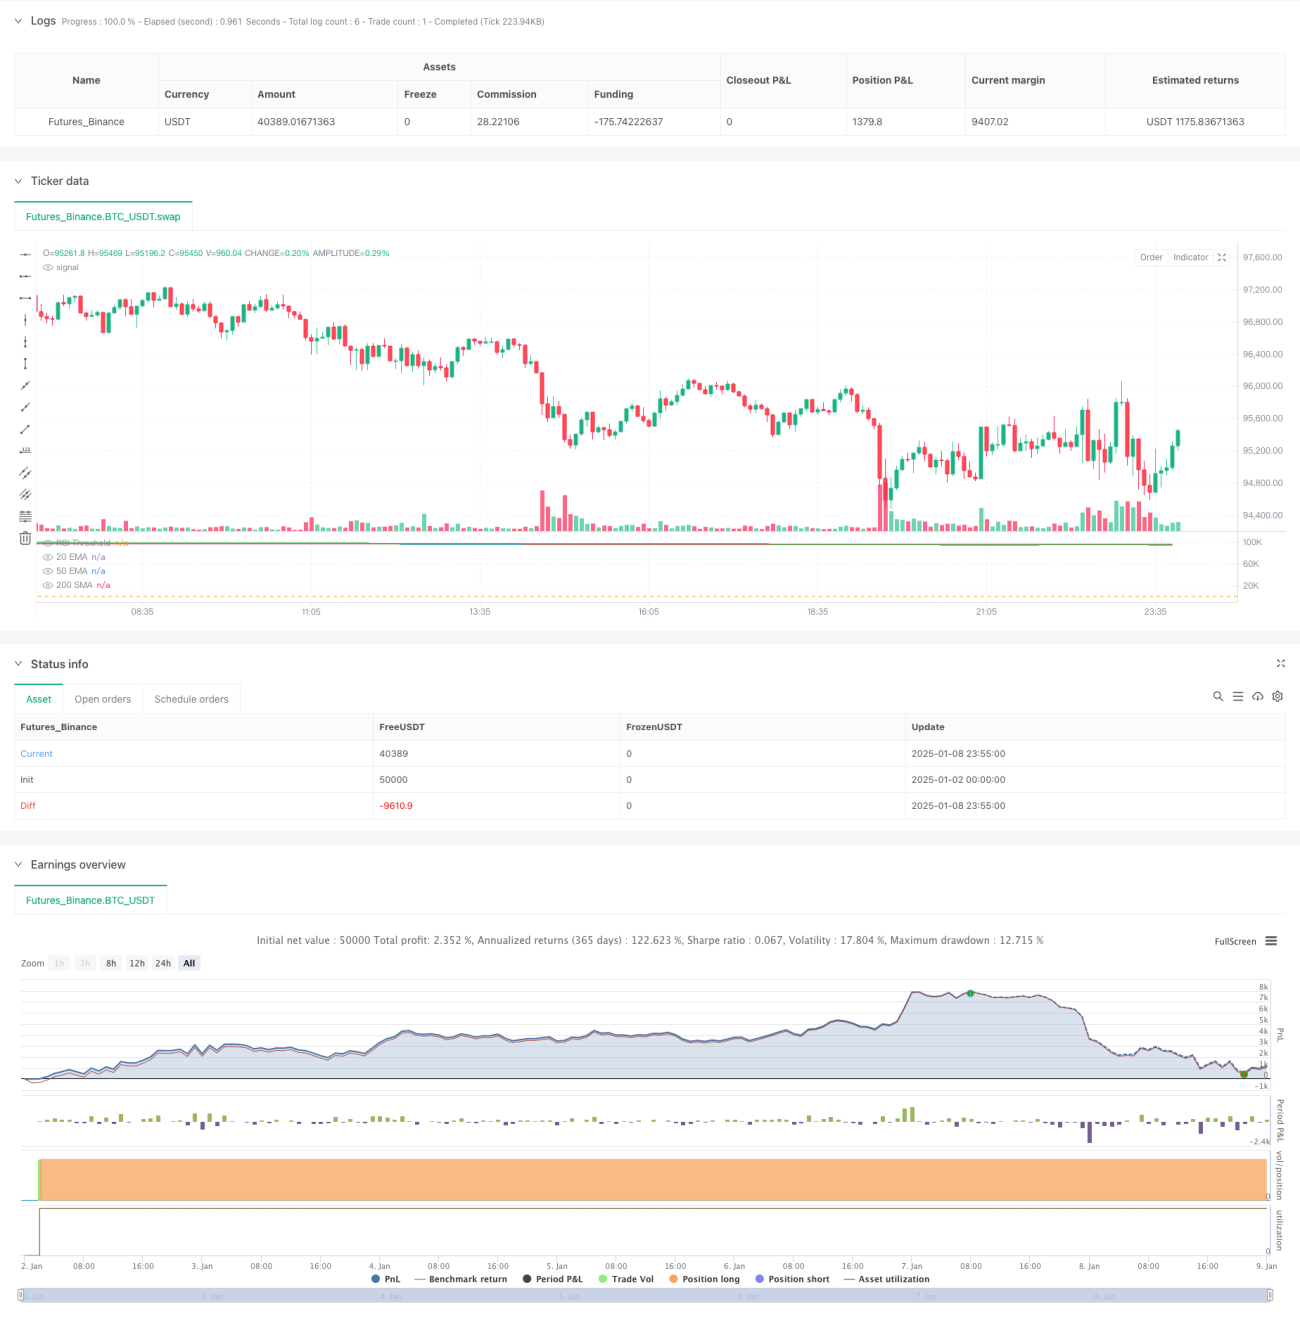
حکمت عملی ایک سے زیادہ متحرک اوسط کراس اوور اور RSI اشارے پر مبنی ایک رجحان کی پیروی کرنے والا تجارتی نظام ہے۔ یہ حکمت عملی EMA20، EMA50 اور SMA200 کی تین موونگ ایوریجز کو یکجا کرتی ہے، مارکیٹ کے رجحان کو موونگ ایوریجز کے پوزیشن ریلیشن شپ سے جج کرتی ہے، اور ٹریڈنگ سگنلز کو فلٹر کرنے کے لیے RSI انڈیکیٹر کا استعمال کرتی ہے، اور جب قیمت پچھلی بلندی سے ٹوٹ جاتی ہے تو تجارت کرتی ہے۔ حکمت عملی طے شدہ منافع اور نقصان کو روکنے کے حالات کا تعین کرتی ہے اور 1 گھنٹے اور روزانہ کی سطح پر چلنے کے لیے موزوں ہے۔
حکمت عملی کا اصول
حکمت عملی کی بنیادی منطق درج ذیل کلیدی شرائط پر مبنی ہے:
- رجحان کا فیصلہ: EMA20 کا EMA50 سے اوپر ہونا ضروری ہے، اور SMA200 کو EMA20 اور EMA50 سے نیچے ہونا ضروری ہے تاکہ اوپر کے رجحان کو یقینی بنایا جا سکے۔
- قیمت کی پوزیشن: موجودہ اختتامی قیمت EMA20 یا EMA50 کے 1% کے اندر ہونی چاہیے تاکہ یہ یقینی بنایا جا سکے کہ یہ کلیدی سپورٹ لیول پر ہے۔
- RSI فلٹرنگ: مضبوط مارکیٹوں کو فلٹر کرنے کے لیے RSI کی قدر مقررہ حد (ڈیفالٹ 40) سے زیادہ ہونی چاہیے۔
- اندراج کا محرک: جب قیمت پچھلی کینڈل سٹک سے زیادہ ہوتی ہے تو ایک لمبا سگنل متحرک ہوتا ہے۔
- رسک مینجمنٹ: رسک کنٹرول کے لیے 25% ٹیک پرافٹ لیول اور 10% اسٹاپ لاس لیول سیٹ کریں۔
اسٹریٹجک فوائد
- متعدد تصدیقی طریقہ کار: متعدد جہتوں کے ذریعے تجارتی سگنلز کی تصدیق کریں جیسے موونگ ایوریج سسٹم، RSI انڈیکیٹر اور غلط سگنلز کو کم کرنے کے لیے قیمت کی پیش رفت۔
- مضبوط رجحان سے باخبر رہنا: درمیانی اور طویل مدتی رجحانات کا تعین کرنے اور تجارتی سمتوں کی درستگی کو بہتر بنانے کے لیے متعدد متحرک اوسط نظاموں کا استعمال کریں۔
- پرفیکٹ رسک مینجمنٹ: ہر لین دین کے خطرے کو مؤثر طریقے سے کنٹرول کرنے کے لیے فکسڈ ٹیک-پرافٹ اور اسٹاپ لاس ریشوز سیٹ کریں۔
- اچھی موافقت: حکمت عملی کے پیرامیٹرز مختلف مارکیٹ کے ماحول کے مطابق ہونے کے قابل ہیں۔
- واضح عمل درآمد: داخلے اور خارجی شرائط واضح اور پروگرام کے لحاظ سے لاگو کرنے میں آسان ہیں۔
اسٹریٹجک رسک
- کٹے ہوئے بازار کا خطرہ: ایک طرف اور کٹے ہوئے بازار میں بار بار غلط سگنل پیدا ہو سکتے ہیں۔
- وقفہ کا خطرہ: موونگ ایوریج سسٹم میں ایک خاص وقفہ ہوتا ہے، اور آپ داخلے کا بہترین موقع کھو سکتے ہیں۔
- سٹاپ نقصان مارجن کا خطرہ: فکسڈ سٹاپ نقصان کا تناسب مارکیٹ کے تمام حالات میں مناسب نہیں ہو سکتا۔
- ڈرا ڈاؤن کا خطرہ: رجحان کے الٹ جانے پر ایک بڑی کمی ہو سکتی ہے۔
حکمت عملی کی اصلاح کی سمت
- متحرک پیرامیٹر کی اصلاح: متحرک طور پر متحرک اوسط مدت اور RSI حد کو مارکیٹ کے اتار چڑھاؤ کے مطابق ایڈجسٹ کریں۔
- مارکیٹ کے ماحول کی شناخت: مارکیٹ کے ماحول کے فیصلے کا طریقہ کار شامل کریں اور مختلف بازار کے ماحول میں مختلف پیرامیٹر کے امتزاج کا استعمال کریں۔
- ڈائنامک ٹیک پرافٹ اور اسٹاپ لاس: اے ٹی آر یا اتار چڑھاؤ کی بنیاد پر ڈائنامک ٹیک پرافٹ اور اسٹاپ لاس لیول سیٹ کریں۔
- حجم کا تجزیہ شامل کریں: سگنل کی وشوسنییتا کو بہتر بنانے کے لیے حجم کے اشارے کے ساتھ مل کر۔
- ایگزٹ میکانزم کو بہتر بنائیں: منافع کو بہتر بنانے کے لیے زیادہ لچکدار ایگزٹ میکانزم تیار کریں۔
خلاصہ کریں۔
یہ حکمت عملی ایک مکمل ڈھانچہ اور واضح منطق کے ساتھ ٹرینڈ ٹریکنگ سسٹم ہے۔ متعدد تکنیکی اشاریوں کے مربوط استعمال کے ذریعے، مارکیٹ کے رجحانات کو مؤثر طریقے سے پکڑنا ممکن ہے اور ساتھ ہی ساتھ ایک مکمل رسک مینجمنٹ میکانزم بھی ہے۔ حکمت عملی کو بہتر بنانے کی ایک بڑی گنجائش ہے، اور مسلسل بہتری حکمت عملی کے استحکام اور منافع کو مزید بڑھا سکتی ہے۔ درمیانی اور طویل مدتی تاجروں کے لیے، یہ کوشش کرنے کے قابل حکمت عملی کا فریم ورک ہے۔
- 1