اعلی تعدد قیمت اور حجم کے رجحان سے باخبر رہنے اور حجم کے تجزیے کے موافق حکمت عملی

جائزہ
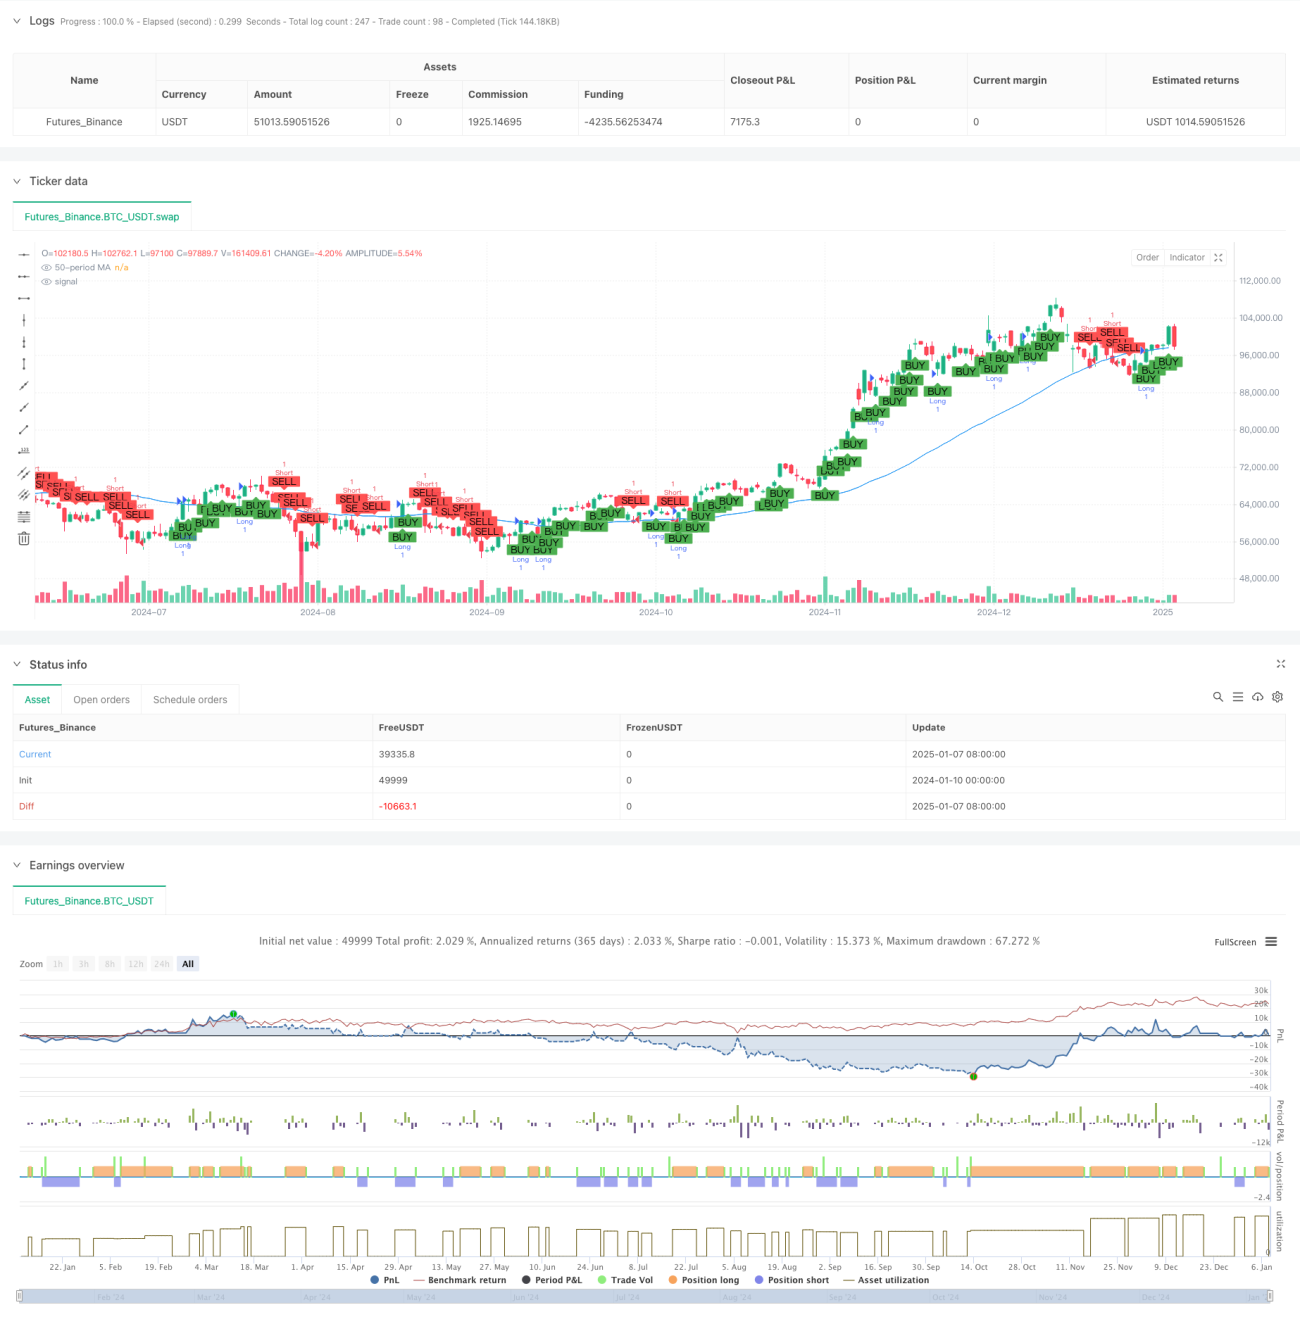
حکمت عملی 5 منٹ کے ٹائم فریم پر مبنی ایک خودکار تجارتی نظام ہے جو حرکت پذیر اوسط رجحان کی پیروی اور حجم کے تجزیہ کے طریقوں کو یکجا کرتا ہے۔ حکمت عملی مارکیٹ کے رجحانات کا تعین کرنے کے لیے 50 مدت کی سادہ موونگ ایوریج (SMA) کا استعمال کرتی ہے اور تجارتی سگنلز کی درستگی کی تصدیق کے لیے حجم کا تجزیہ متعارف کراتی ہے۔ سسٹم مکمل طور پر خودکار ٹریڈنگ حاصل کرنے کے لیے فکسڈ سٹاپ نقصان اور منافع کے اہداف کا استعمال کرتا ہے۔
حکمت عملی کا اصول
حکمت عملی کی بنیادی منطق میں درج ذیل کلیدی اجزاء شامل ہیں:
- رجحان کی شناخت: مارکیٹ کی سمت کا تعین کرنے کے لیے 50-پیریڈ SMA استعمال کریں جب بند ہونے والی قیمت حرکت پذیر اوسط سے زیادہ ہوتی ہے، تو اسے اوپر کا رجحان سمجھا جاتا ہے، بصورت دیگر یہ نیچے کا رجحان ہے۔ ایک ہی وقت میں، گزشتہ 30 منٹوں میں قیمت کے رجحان (6 K-لائنز) کو ملا کر رجحان کی تصدیق کی جاتی ہے۔
- حجم کا تجزیہ: قیمت کے اتار چڑھاو کی بنیاد پر خرید و فروخت کے حجم کا حساب لگائیں، اور اختتامی قیمت کی پوزیشن کے مطابق ہر K-لائن کے اندر والیوم کو خرید و فروخت کے حجم میں مختص کریں۔
- ٹریڈنگ سگنل جنریشن: اوپر کی جانب رجحان میں، ایک لمبا سگنل اس وقت پیدا ہوتا ہے جب خرید کا حجم فروخت کے حجم سے زیادہ ہوتا ہے، جب فروخت کا حجم خرید کے حجم سے زیادہ ہوتا ہے۔
- رسک کنٹرول: ہر تجارت کے رسک ریوارڈ ریشو کو منظم کرنے کے لیے 3% سٹاپ نقصان اور 29% منافع کا ہدف استعمال کریں۔
اسٹریٹجک فوائد
- کثیر جہتی رجحان کی تصدیق: چلتی اوسط اور قلیل مدتی قیمت کے رجحانات کو ملا کر رجحان کی دوگنی تصدیق کرنے سے، رجحان کے فیصلے کی درستگی بہتر ہوتی ہے۔
- حجم کی توثیق: کم حجم والے ماحول میں غلط بریک آؤٹ سے بچنے کے لیے تجارتی سگنل فلٹر کے طور پر حجم کے تجزیہ کو متعارف کروائیں۔
- پرفیکٹ رسک مینجمنٹ: ایک لین دین کے خطرے کو مؤثر طریقے سے کنٹرول کرنے کے لیے واضح سٹاپ نقصان اور منافع کے اہداف مقرر کریں۔
- مضبوط موافقت: حکمت عملی مارکیٹ کی حیثیت کے مطابق لین دین کی سمت کو خود بخود ایڈجسٹ کر سکتی ہے اور مارکیٹ کے مختلف ماحول کے مطابق ڈھال سکتی ہے۔
اسٹریٹجک رسک
- اتار چڑھاؤ والے بازار کا خطرہ: متواتر غلط بریک آؤٹ سگنلز ایک طرف اور اتار چڑھاؤ والے بازار میں ہو سکتے ہیں، جس کے نتیجے میں مسلسل سٹاپ نقصانات ہوتے ہیں۔
- پھسلنے کا خطرہ: ہائی فریکوئنسی ٹریڈنگ میں، آپ کو بڑی پھسلن کا سامنا کرنا پڑ سکتا ہے، جو کہ عمل درآمد کے اصل اثر کو متاثر کرے گا۔
- پیرامیٹر کی حساسیت: حکمت عملی کا اثر پیرامیٹرز کے لیے حساس ہوتا ہے جیسے حرکت پذیری اوسط مدت اور تجارتی حجم کے حساب کتاب کی مدت۔
- مارکیٹ کے ماحول پر انحصار: حکمت عملی واضح رجحان کے ساتھ مارکیٹ میں اچھی کارکردگی کا مظاہرہ کرتی ہے، لیکن رجحان کی منتقلی کے ادوار کے دوران بڑی کمی کا سامنا کر سکتا ہے۔
حکمت عملی کی اصلاح کی سمت
- ڈائنامک پیرامیٹر آپٹیمائزیشن: مارکیٹ کے اتار چڑھاؤ کے مطابق متحرک اوسط مدت اور تجارتی حجم کے حساب کتاب کی مدت کو متحرک طور پر ایڈجسٹ کرنے کے لیے ایک انکولی پیرامیٹر میکانزم متعارف کرایا جا سکتا ہے۔
- مارکیٹ کے ماحول کی فلٹرنگ میں اضافہ کریں: اتار چڑھاؤ کے اشارے یا رجحان کی طاقت کے اشارے شامل کریں تاکہ مارکیٹ کے نامناسب حالات میں تجارت کو خود بخود روکا جا سکے۔
- سٹاپ لوس میکانزم کو بہتر بنائیں: ڈائنامک سٹاپ لاس، جیسے ٹریلنگ سٹاپ لاس یا اے ٹی آر پر مبنی سٹاپ لاس، رسک کنٹرول کی لچک کو بڑھانے کے لیے استعمال کیا جا سکتا ہے۔
- سگنل جنریشن منطق کو بہتر بنائیں: سگنل کی بھروسے کو بہتر بنانے کے لیے کراس توثیق کے لیے مزید تکنیکی اشارے شامل کرنے پر غور کریں۔
خلاصہ کریں۔
یہ حکمت عملی ٹرینڈ ٹریکنگ اور حجم کے تجزیے کو ملا کر ایک مکمل ہائی فریکوئنسی ٹریڈنگ سسٹم بناتی ہے۔ حکمت عملی کے اہم فوائد اس کے کثیر جہتی سگنل کی تصدیق کے طریقہ کار اور کامل رسک کنٹرول سسٹم میں ہیں۔ اگرچہ کچھ موروثی خطرات ہیں، تجویز کردہ اصلاحی ہدایات کے ذریعے حکمت عملی کے استحکام اور موافقت کو مزید بہتر بنایا جا سکتا ہے۔ حکمت عملی واضح رجحانات کے ساتھ مارکیٹ کے ماحول میں کام کرنے کے لیے خاص طور پر موزوں ہے، اور مناسب پیرامیٹر کی اصلاح اور رسک مینجمنٹ کے ذریعے مستحکم تجارتی نتائج حاصل کرنے کی توقع ہے۔
/*backtest
start: 2024-01-10 00:00:00
end: 2025-01-08 08:00:00
period: 1d
basePeriod: 1d
exchanges: [{"eid":"Futures_Binance","currency":"BTC_USDT","balance":49999}]
*/

// This Pine Script™ code is subject to the terms of the Mozilla Public License 2.0 at https://mozilla.org/MPL/2.0/
// © Jerryorange

//@version=6- 1