
جائزہ
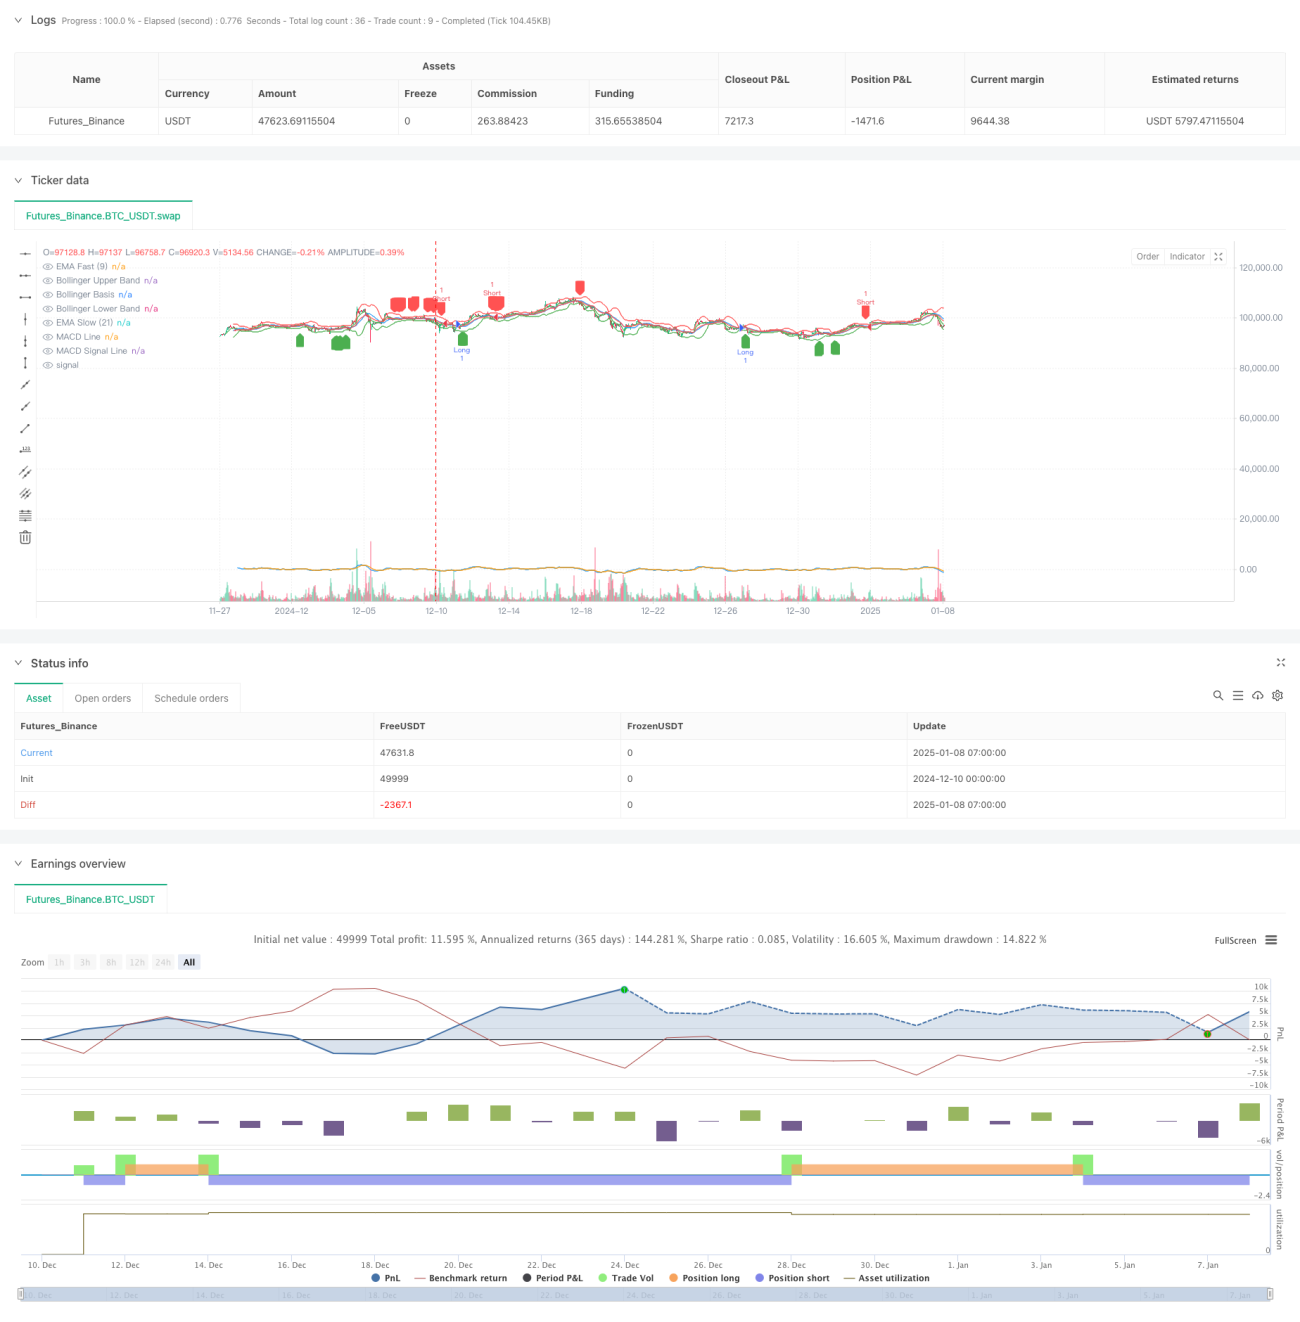
یہ حکمت عملی ایک کثیر جہتی تکنیکی تجزیہ پر مبنی تجارتی نظام ہے، جس میں رفتار کے اشارے (RSI, MACD)، رجحان کے اشارے (EMA)، اتار چڑھاؤ کے اشارے (Bollinger Bands, ATR) اور قیمت کے ڈھانچے کے اشارے (Fibonacci Retracement) کو یکجا کیا گیا ہے۔ کثیر جہتی سگنلز کے باہمی تعاون کے ذریعے مارکیٹ کے مواقع کو گرفت میں لیا جاتا ہے۔ حکمت عملی 15 منٹ کے ٹائم فریم پر مبنی ہے اور ATR پر مبنی متحرک سٹاپ لاس اور ٹیک پروفٹ استعمال کرتی ہے، جس میں رسک کنٹرول کی مضبوط صلاحیت موجود ہے۔
حکمت عملی کا اصول
حکمت عملی کے بنیادی منطق میں درج ذیل جہتیں شامل ہیں:
- رجحان کی تصدیق: 9/21 دورانیے کے EMA کے کراس اوور سے رجحان کی سمت کا تعین کیا جاتا ہے۔
- رفتار کی تصدیق: RSI کے اوور سولڈ/اوور باؤٹ (55/45) اور MACD ہسٹوگرام کو ملا کر رفتار کی تصدیق کی جاتی ہے۔
- اتار چڑھاؤ کا حوالہ: Bollinger Bands (20 دورانیہ، 2 معیاری انحراف) کے ذریعے قیمت کے اتار چڑھاؤ کو ناپا جاتا ہے۔
- مزاحمت و سپورٹ: 100 دورانیے کی اونچی/نیچی قیمتوں سے شمار کردہ Fibonacci 0.382/0.618/0.786 کی سطحیں استعمال ہوتی ہیں۔
- رسک مینجمنٹ: 14 دورانیے کے ATR پر مبنی 1.5 گنا سٹاپ لاس اور 3 گنا ٹیک پروفٹ استعمال ہوتا ہے۔
کثیر جہتی سگنلز کے باہمی تعاون کے بعد ہی ٹریڈنگ شروع کی جاتی ہے، جس سے تجارت کی درستگی بڑھ جاتی ہے۔
حکمت عملی کے فوائد
- کثیر جہتی سگنلز کی کراس تصدیق، جعلی سگنلز میں نمایاں کمی۔
- متحرک ATR سٹاپ لاس اور ٹیک پروفٹ، مختلف مارکیٹ کے حالات کے مطابق ڈھلنے کی صلاحیت۔
- کلاسیکی تکنیکی اشاروں کا استعمال، سمجھنے اور برقرار رکھنے میں آسانی۔
- درست اندراج کے مواقع کا انتخاب، جیتنے کی شرح میں اضافہ۔
- رسک ٹو ریوارڈ کا تناسب 1:2، پیشہ ورانہ تجارتی معیارات کے مطابق۔
- زیادہ اتار چڑھاؤ والی مارکیٹ کے حالات کے لیے موزوں۔
حکمت عملی کے خطرات
- پیرامیٹر آپٹیمائزیشن اوور فٹنگ کا سبب بن سکتی ہے۔
- ایک سے زیادہ سگنل کی شرائط کچھ مارکیٹ کی حرکتوں سے محروم کر سکتی ہیں۔
- طے شدہ ضربی سٹاپ لاس انتہائی مارکیٹ کے حالات میں ناکام ہو سکتا ہے۔
- کمپیوٹیشنل وسائل کی زیادہ ضرورت ہوتی ہے۔
- ٹریڈنگ کے اخراجات حکمت عملی کی کارکردگی کو متاثر کر سکتے ہیں۔
حکمت عملی کی بہتری کے شعبے
- سگنل کی طاقت کی تصدیق کے لیے والیوم فیکٹر شامل کرنا۔
- مختلف مارکیٹوں کے مطابق ڈھالنے کے لیے RSI کی حدوں کو متحرک طور پر ایڈجسٹ کرنا۔
- رجحان کی طاقت کا فلٹر شامل کرنا۔
- سٹاپ لاس اور ٹیک پروفٹ کے ضربوں کو بہتر بنانا۔
- سائیڈ وے مارکیٹ سے بچنے کے لیے وقت کا فلٹر شامل کرنا۔
- پیرامیٹرز کی متحرک اصلاح کے لیے مشین لرننگ متعارف کرانے پر غور کرنا۔
خلاصہ
یہ حکمت عملی کثیر جہتی تکنیکی اشاروں کے باہمی تعاون کے ذریعے ایک مضبوط تجارتی نظام تشکیل دیتی ہے۔ اس کا بنیادی فائدہ سگنلز کی کراس تصدیق اور متحرک رسک کنٹرول ہے، تاہم پیرامیٹر آپٹیمائزیشن اور مارکیٹ کے حالات کے مطابق ڈھلنے کے مسائل پر بھی توجہ دینے کی ضرورت ہے۔ مستقبل میں بہتری کی سمت بنیادی طور پر متحرک پیرامیٹر ایڈجسٹمنٹ اور سگنل کے معیار میں اضافے پر مرکوز ہے۔
- 1