
جائزہ
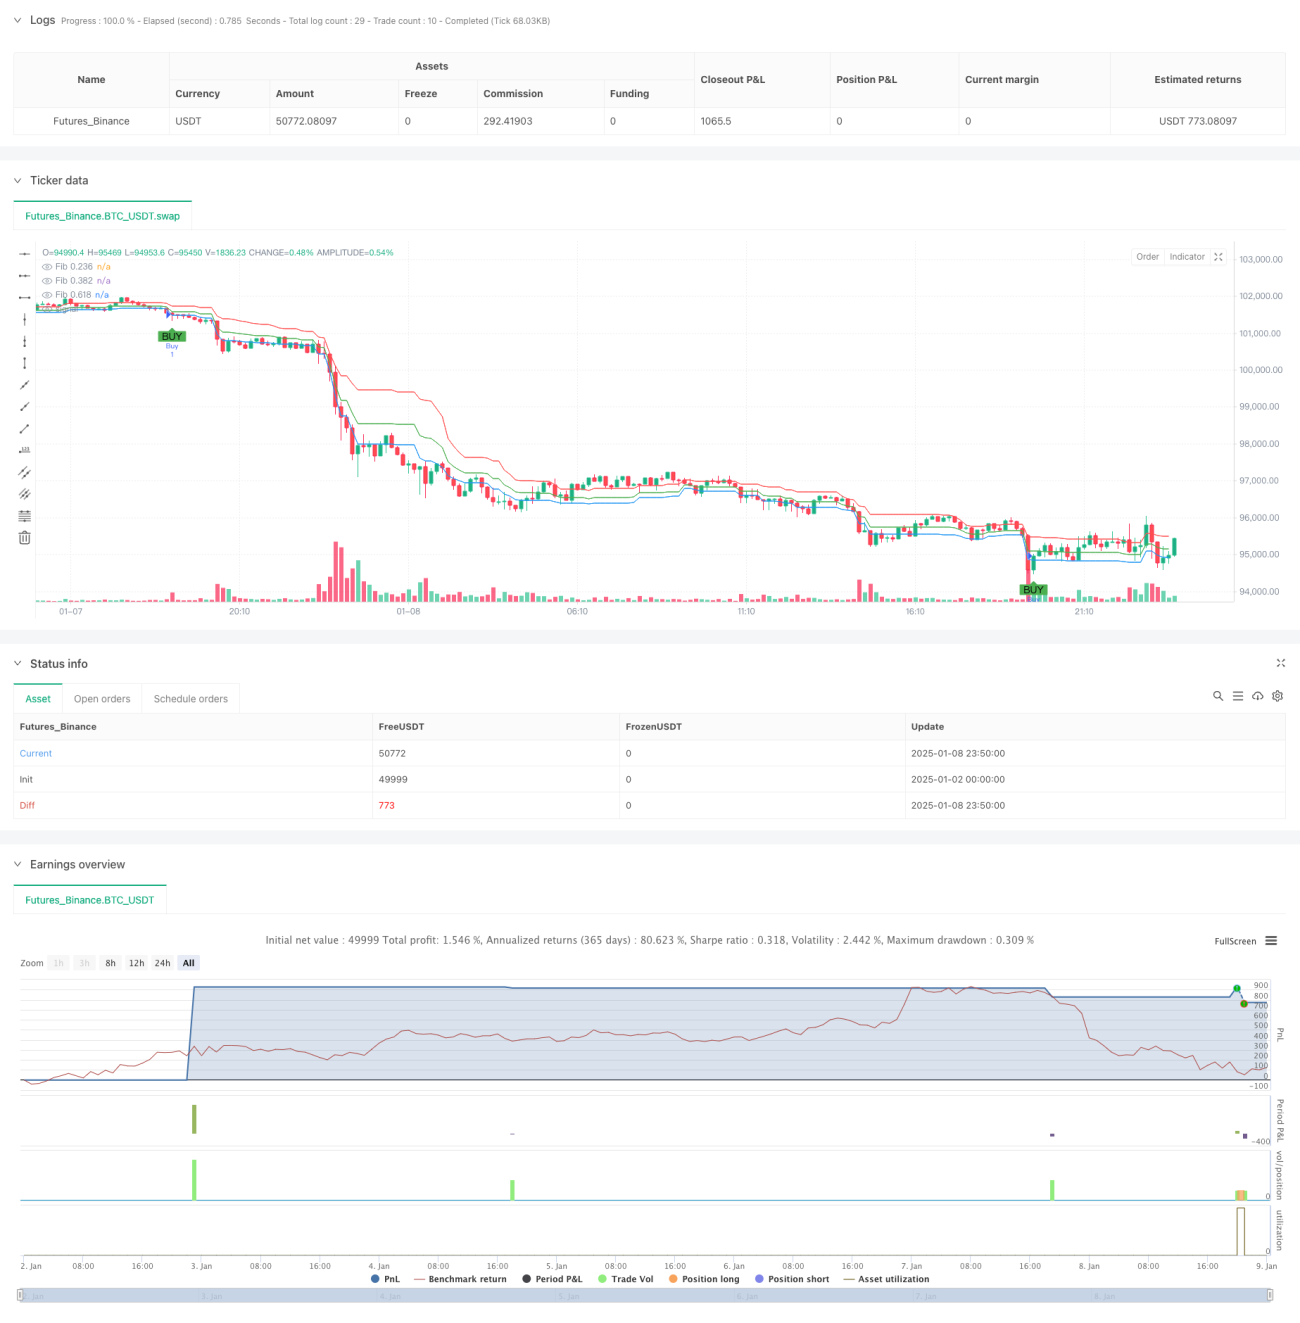
یہ حکمت عملی ایک دن کا تجارتی نظام ہے جو بولنگر بینڈز اور فبونیکی ریٹیسمنٹ لیولز کو یکجا کرتا ہے۔ یہ بولنگر بینڈ کے اشارے کا استعمال زیادہ خریدی ہوئی اور زیادہ فروخت ہونے والی حالتوں کی نشاندہی کرنے کے لیے کرتا ہے، جبکہ ممکنہ سپورٹ اور مزاحمتی سطحوں کی تصدیق کے لیے Fibonacci retracement لیولز کا استعمال کرتا ہے، اس طرح مارکیٹ کے اتار چڑھاو میں تجارتی مواقع کو پکڑتا ہے۔ اس حکمت عملی میں 20 مدت کے بولنگر بینڈز اور 0.236، 0.382، اور 0.618 کے تین کلیدی فبونیکی لیولز سگنل جنریشن کے لیے استعمال کیے گئے ہیں۔
حکمت عملی کا اصول
حکمت عملی کی بنیادی منطق درج ذیل کلیدی عناصر پر مبنی ہے:
- قیمتوں کے زیادہ خریدے ہوئے اور زیادہ فروخت ہونے والے علاقوں کو نشان زد کرنے کے لیے اوپری اور نچلے بولنگر بینڈز (معیاری انحراف 2 ہے) استعمال کریں۔
- آخری 20 ادوار کی سب سے زیادہ اور سب سے کم قیمتوں کا استعمال کرکے Fibonacci retracement کی سطح کا حساب لگائیں۔
- جب قیمت نچلے بولنگر بینڈ کے اوپر اور فبونیکی 0.236 یا 0.382 سپورٹ لیول سے اوپر ٹوٹ جاتی ہے تو خرید سگنل تیار ہوتا ہے۔
- جب قیمت اوپری بولنگر بینڈ کے اوپر اور فبونیکی 0.618 مزاحمتی سطح سے نیچے آجاتی ہے تو فروخت کا سگنل پیدا ہوتا ہے۔
- خطرے کو کنٹرول کرنے اور منافع کو بند کرنے کے لیے فکسڈ سٹاپ نقصان کا استعمال کریں اور منافع کے پوائنٹس لیں۔
اسٹریٹجک فوائد
- رجحان اور حمایت اور مزاحمت کے دوہری تصدیقی طریقہ کار کے ساتھ مل کر، تجارتی سگنلز کی وشوسنییتا بہتر ہوتی ہے۔
- بولنگر بینڈ متحرک طور پر مارکیٹ کے اتار چڑھاؤ میں ہونے والی تبدیلیوں کے مطابق ڈھال سکتے ہیں، حکمت عملی کو انتہائی قابل موافق بناتے ہیں۔
- فبونیکی سطح اندراجات اور اخراج کے لیے حوالہ کا واضح فریم فراہم کرتی ہے۔
- فکسڈ سٹاپ نقصان اور ٹیک پرافٹ سیٹنگز خطرات کو سختی سے کنٹرول کرنے میں مدد کرتی ہیں۔
- حکمت عملی کے پیرامیٹرز کو مارکیٹ کے مختلف حالات کے مطابق لچکدار طریقے سے ایڈجسٹ کیا جا سکتا ہے۔
اسٹریٹجک رسک
- متواتر غلط بریک آؤٹ سگنلز غیر مستحکم مارکیٹ میں ہو سکتے ہیں۔
- فکسڈ سٹاپ نقصان اور ٹیک پرافٹ سیٹنگز مارکیٹ کے تمام حالات کے لیے موزوں نہیں ہو سکتی ہیں۔
- فبونیکی سطحوں کی تاثیر مارکیٹ کی ساخت سے بہت متاثر ہوتی ہے۔
- تیزی سے رجحان ساز بازاروں میں، مارکیٹ کی کچھ حرکتیں چھوٹ سکتی ہیں۔
- مارکیٹ کی تبدیلیوں کو اپنانے کے لیے پیرامیٹرز کی مسلسل نگرانی اور ایڈجسٹ کرنے کی ضرورت ہے۔
حکمت عملی کی اصلاح کی سمت
- بریک آؤٹ کی درستگی کی تصدیق کے لیے والیوم انڈیکیٹرز کا تعارف
- مارکیٹ کے اتار چڑھاؤ کے مطابق سٹاپ نقصان کو متحرک طور پر ایڈجسٹ کریں اور منافع کی سطح لیں۔
- سائیڈ وے مارکیٹوں میں ٹریڈنگ سے بچنے کے لیے ٹرینڈ فلٹر شامل کیا گیا۔
- فبونیکی سطحوں کے حساب کی مدت کو بہتر بنانا
- کم لیکویڈیٹی ادوار میں ٹریڈنگ سے بچنے کے لیے ٹائم فلٹرز شامل کرنے پر غور کریں۔
خلاصہ کریں۔
یہ ایک مکمل تجارتی نظام ہے جو تکنیکی تجزیہ کے کلاسک ٹولز کو یکجا کرتا ہے، جو تاجروں کو بولنگر بینڈز اور فبونیکی ریٹریسمنٹ کی ہم آہنگی کے ذریعے ایک منظم تجارتی فریم ورک فراہم کرتا ہے۔ اگرچہ کچھ حدود ہیں، یہ حکمت عملی مناسب پیرامیٹر کی اصلاح اور رسک مینجمنٹ کے ذریعے انٹرا ڈے ٹریڈنگ میں اچھی طرح کام کر سکتی ہے۔ خاص تجارتی مصنوعات اور مارکیٹ کے حالات کی بنیاد پر متعلقہ ایڈجسٹمنٹ اور اصلاح کرنا اہم ہے۔
- 1