متعدد متحرک اوسط رجحان سے باخبر رہنے اور متحرک اتار چڑھاؤ کو فلٹر کرنے کی حکمت عملی

EMA TR ATR
تخلیق کی تاریخ: 2025-01-17 15:00:37 آخر میں ترمیم کریں: 2025-01-17 15:00:37
کاپی: 3 کلکس کی تعداد: 303
1
پر توجہ دیں
1617
پیروکار

متعدد متحرک اوسط رجحان سے باخبر رہنے اور متحرک اتار چڑھاؤ کو فلٹر کرنے کی حکمت عملی

جائزہ

حکمت عملی ایک ذہین تجارتی نظام ہے جو رجحان کی پیروی اور اتار چڑھاؤ کی فلٹرنگ کو یکجا کرتا ہے۔ یہ ایکسپونیشل موونگ ایوریج (EMA) کے ذریعے مارکیٹ کے رجحانات کی نشاندہی کرتا ہے، داخلے کے وقت کا تعین کرنے کے لیے ٹرو رینج (TR) اور متحرک اتار چڑھاؤ کے فلٹرز کا استعمال کرتا ہے، اور اتار چڑھاؤ کی بنیاد پر متحرک اسٹاپ پرافٹ اور اسٹاپ لوس میکانزم کے ساتھ خطرے کا انتظام کرتا ہے۔ حکمت عملی دو تجارتی طریقوں کو سپورٹ کرتی ہے: اسکیلپ اور سوئنگ، جو مختلف مارکیٹ کے ماحول اور تجارتی انداز کے مطابق لچکدار طریقے سے تبدیل کیے جا سکتے ہیں۔

حکمت عملی کا اصول

حکمت عملی کی بنیادی منطق میں درج ذیل کلیدی اجزاء شامل ہیں:

  1. رجحان کی شناخت: 50 مدت کے EMA کو بطور ٹرینڈ فلٹر استعمال کریں اور صرف اس وقت لمبا کریں جب قیمت EMA سے زیادہ ہو اور جب قیمت EMA سے کم ہو تو مختصر ہو جائے۔
  2. اتار چڑھاؤ فلٹرنگ: ٹرو رینج (TR) کے EMA کا حساب لگاتا ہے اور مارکیٹ کے شور کو فلٹر کرنے کے لیے ایڈجسٹ فلٹر فیکٹر (ڈیفالٹ 1.5) استعمال کرتا ہے۔
  3. اندراج کی شرائط: تین مسلسل K-لائنوں کے مورفولوجیکل تجزیہ کے ساتھ مل کر، قیمت کی حرکت مسلسل اور تیز ہونی چاہیے۔
  4. ٹیک پرافٹ اینڈ سٹاپ لاس: قلیل مدتی موڈ میں، یہ بینڈ موڈ میں موجودہ TR کی بنیاد پر سیٹ کیا جاتا ہے، یہ متحرک رسک مینجمنٹ کو حاصل کرنے کے لیے پچھلے اعلی اور کم پوائنٹس کی بنیاد پر سیٹ کیا جاتا ہے۔

اسٹریٹجک فوائد

  1. مضبوط موافقت: متحرک اتار چڑھاؤ کی فلٹرنگ اور رجحان سے باخبر رہنے کے امتزاج کے ذریعے، یہ مختلف مارکیٹ کے ماحول کو اپنا سکتا ہے۔
  2. پرفیکٹ رسک مینجمنٹ: دو ٹریڈنگ طریقوں کے لیے ڈائنامک سٹاپ-پرافٹ اور سٹاپ-لاس میکانزم فراہم کریں، جنہیں مارکیٹ کی خصوصیات کے مطابق لچکدار طریقے سے منتخب کیا جا سکتا ہے۔
  3. اچھی پیرامیٹر ایڈجسٹ ایبلٹی: کلیدی پیرامیٹرز جیسے فلٹر کوفیشینٹ، ٹرینڈ سائیکل وغیرہ کو تجارتی مصنوعات کی خصوصیات کے مطابق بہتر بنایا جا سکتا ہے۔
  4. اچھا ویژولائزیشن اثر: لین دین کی نگرانی کو آسان بنانے کے لیے واضح خرید و فروخت کے سگنل اور اسٹاپ پرافٹ اور اسٹاپ لاس پوزیشن ڈسپلے فراہم کرتا ہے۔

اسٹریٹجک رسک

  1. رجحان کے الٹ جانے کا خطرہ: ٹرینڈ ٹرننگ پوائنٹس پر لگاتار اسٹاپس ہو سکتے ہیں۔
  2. غلط بریک آؤٹ کا خطرہ: جب اتار چڑھاؤ اچانک بڑھ جاتا ہے تو غلط سگنلز شروع ہو سکتے ہیں۔
  3. پیرامیٹر کی حساسیت: فلٹر گتانک کی غلط ترتیب کے نتیجے میں بہت زیادہ یا بہت کم سگنل ہو سکتا ہے۔
  4. پھسلن کا اثر: تیز بازار میں، آپ کو بڑی پھسلن کا سامنا کرنا پڑ سکتا ہے، جو آپ کی حکمت عملی کی کارکردگی کو متاثر کر سکتا ہے۔

حکمت عملی کی اصلاح کی سمت

  1. رجحان کی طاقت کی فلٹرنگ شامل کریں: رجحان کی طاقت کا اندازہ کرنے اور رجحان سے باخبر رہنے کے اثرات کو بہتر بنانے کے لیے ADX جیسے اشارے متعارف کرائے جا سکتے ہیں۔
  2. ٹیک-پرافٹ اور اسٹاپ لاس کو بہتر بنائیں: مزید منافع کی حفاظت کے لیے ایک متحرک اسٹاپ لاس متعارف کرانے پر غور کریں۔
  3. سوئنگ ٹریڈنگ ماڈل کو بہتر بنائیں: درمیانی اور طویل مدتی ہولڈنگ کی صلاحیتوں کو بہتر بنانے کے لیے مزید سوئنگ ٹریڈنگ کے لیے مخصوص فیصلے کی شرائط شامل کی جا سکتی ہیں۔
  4. حجم کا تجزیہ شامل کریں: پیش رفت کی درستگی کی تصدیق کے لیے حجم کی تبدیلیوں کو یکجا کریں۔

خلاصہ کریں۔

یہ حکمت عملی رجحان سے باخبر رہنے، اتار چڑھاؤ کی فلٹرنگ اور متحرک رسک مینجمنٹ کو باضابطہ طور پر ملا کر ایک مکمل تجارتی نظام تشکیل دیتی ہے۔ حکمت عملی کا فائدہ یہ ہے کہ یہ انتہائی موافقت پذیر اور خطرے پر قابو پانے والی ہے، جبکہ اصلاح کے لیے ایک بڑی جگہ فراہم کرتی ہے۔ پیرامیٹرز کو معقول طریقے سے ترتیب دینے اور مناسب تجارتی طریقوں کا انتخاب کرنے سے، حکمت عملی مختلف مارکیٹ کے ماحول میں مستحکم کارکردگی کو برقرار رکھ سکتی ہے۔ یہ سفارش کی جاتی ہے کہ تاجر حقیقی استعمال سے پہلے کافی بیک ٹیسٹنگ اور پیرامیٹر کی اصلاح کریں، اور مخصوص تجارتی مصنوعات کی خصوصیات کی بنیاد پر متعلقہ ایڈجسٹمنٹ کریں۔
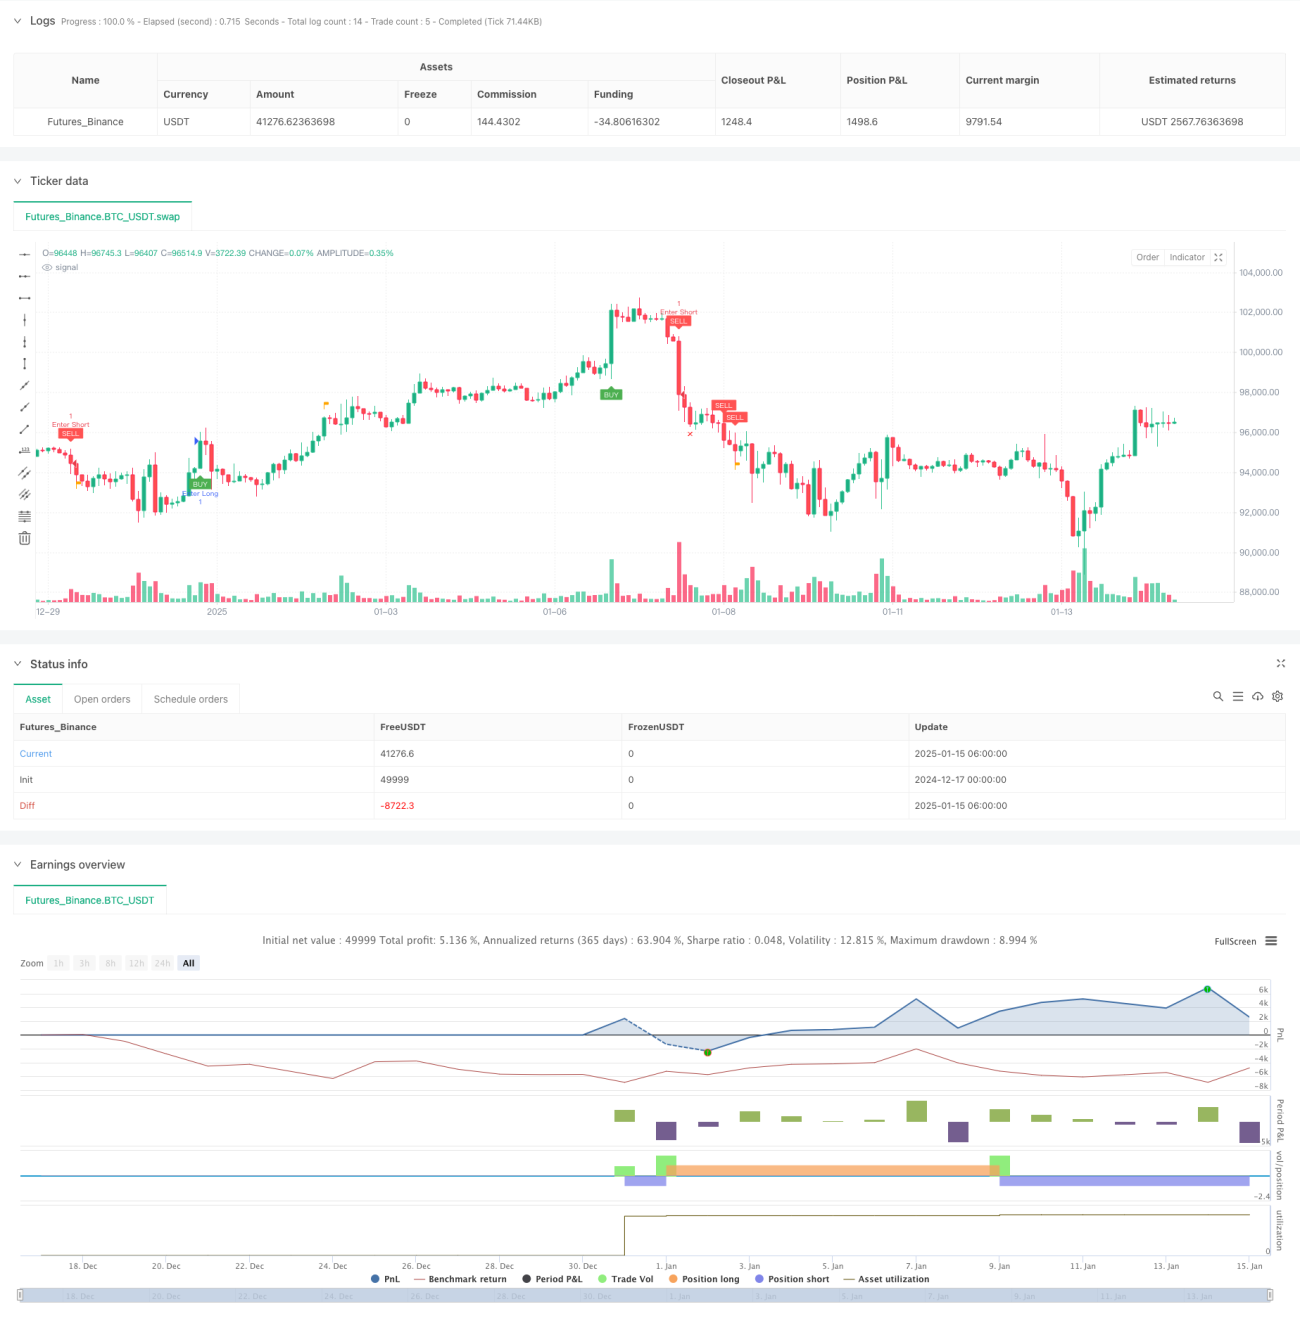
حکمت عملی کا ماخذ کوڈ
/*backtest
start: 2024-12-17 00:00:00
end: 2025-01-15 08:00:00
period: 2h
basePeriod: 2h
exchanges: [{"eid":"Futures_Binance","currency":"BTC_USDT","balance":49999}]
*/

// This Pine Script™ code is subject to the terms of the Mozilla Public License 2.0 at https://mozilla.org/MPL/2.0/
// © Creativ3mindz

//@version=5
strategy("Scalp Slayer (I)", overlay=true)

// Input Parameters
filterNumber = input.float(1.5, "Filter Number", minval=1.0, maxval=10.0, tooltip="Higher = More aggressive Filter, Lower = Less aggressive")
emaTrendPeriod = input.int(50, "EMA Trend Period", minval=1, tooltip="Period for the EMA used for trend filtering")
lookbackPeriod = input.int(20, "Lookback Period for Highs/Lows", minval=1, tooltip="Period for determining recent highs/lows")
colorTP = input.color(title='Take Profit Color', defval=color.orange)
colorSL = input.color(title='Stop Loss Color', defval=color.red)

// Inputs for visibility
showBuyLabels = input.bool(true, title="Show Buy Labels")
showSellLabels = input.bool(true, title="Show Sell Labels")

// Alert Options
alertOnCondition = input.bool(true, title="Alert on Condition Met", tooltip="Enable to alert when condition is met")

// Trade Mode Toggle
tradeMode = input.bool(false, title="Trade Mode (ON = Swing, OFF = Scalp)", tooltip="Swing-mode you can use your own TP/SL.")

// Calculations
tr = high - low
ema = filterNumber * ta.ema(tr, 50)
trendEma = ta.ema(close, emaTrendPeriod)  // Calculate the EMA for the trend filter

// Highest and lowest high/low within lookback period for swing logic
swingHigh = ta.highest(high, lookbackPeriod)
swingLow = ta.lowest(low, lookbackPeriod)

// Variables to track the entry prices and SL/TP levels
var float entryPriceLong = na
var float entryPriceShort = na
var float targetPriceLong = na
var float targetPriceShort = na
var float stopLossLong = na
var float stopLossShort = na
var bool tradeActive = false

// Buy and Sell Conditions with Trend Filter
buyCondition = close > trendEma and  // Buy only if above the trend EMA
      close[2] > open[2] and close[1] > open[1] and close > open and 
      (math.abs(close[2] - open[2]) > math.abs(close[1] - open[1])) and 
      (math.abs(close - open) > math.abs(close[1] - open[1])) and 
      close > close[1] and close[1] > close[2] and tr > ema

sellCondition = close < trendEma and  // Sell only if below the trend EMA
       close[2] < open[2] and close[1] < open[1] and close < open and 
       (math.abs(close[2] - open[2]) > math.abs(close[1] - open[1])) and 
       (math.abs(close - open) > math.abs(close[1] - open[1])) and 
       close < close[1] and close[1] < close[2] and tr > ema

// Entry Rules
if (buyCondition and not tradeActive)
    entryPriceLong := close  // Track entry price for long position
    stopLossLong := tradeMode ? ta.lowest(low, lookbackPeriod) : swingLow  // Scalping: recent low, Swing: lowest low of lookback period
    targetPriceLong := tradeMode ? close + tr : swingHigh  // Scalping: close + ATR, Swing: highest high of lookback period
    tradeActive := true

if (sellCondition and not tradeActive)
    entryPriceShort := close  // Track entry price for short position
    stopLossShort := tradeMode ? ta.highest(high, lookbackPeriod) : swingHigh  // Scalping: recent high, Swing: highest high of lookback period
    targetPriceShort := tradeMode ? close - tr : swingLow  // Scalping: close - ATR, Swing: lowest low of lookback period
    tradeActive := true

// Take Profit and Stop Loss Logic
signalBuyTPPrint = (not na(entryPriceLong) and close >= targetPriceLong)
signalSellTPPrint = (not na(entryPriceShort) and close <= targetPriceShort)

signalBuySLPrint = (not na(entryPriceLong) and close <= stopLossLong)
signalSellSLPrint = (not na(entryPriceShort) and close >= stopLossShort)

if (signalBuyTPPrint or signalBuySLPrint)
    entryPriceLong := na  // Reset entry price for long position
    targetPriceLong := na  // Reset target price for long position
    stopLossLong := na  // Reset stop-loss for long position
    tradeActive := false

if (signalSellTPPrint or signalSellSLPrint)
    entryPriceShort := na  // Reset entry price for short position
    targetPriceShort := na  // Reset target price for short position
    stopLossShort := na  // Reset stop-loss for short position
    tradeActive := false

// Plot Buy and Sell Labels with Visibility Conditions
plotshape(showBuyLabels and buyCondition, "Buy", shape.labelup, location=location.belowbar, color=color.green, text="BUY", textcolor=color.white, size=size.tiny)
plotshape(showSellLabels and sellCondition, "Sell", shape.labeldown, location=location.abovebar, color=color.red, text="SELL", textcolor=color.white, size=size.tiny)

// Plot Take Profit Flags
plotshape(showBuyLabels and signalBuyTPPrint, title="Take Profit (buys)", text="TP", style=shape.flag, location=location.abovebar, color=colorTP, textcolor=color.white, size=size.tiny)
plotshape(showSellLabels and signalSellTPPrint, title="Take Profit (sells)", text="TP", style=shape.flag, location=location.belowbar, color=colorTP, textcolor=color.white, size=size.tiny)

// Plot Stop Loss "X" Marker
plotshape(showBuyLabels and signalBuySLPrint, title="Stop Loss (buys)", text="X", style=shape.xcross, location=location.belowbar, color=colorSL, textcolor=color.white, size=size.tiny)
plotshape(showSellLabels and signalSellSLPrint, title="Stop Loss (sells)", text="X", style=shape.xcross, location=location.abovebar, color=colorSL, textcolor=color.white, size=size.tiny)

// Alerts

alertcondition(buyCondition and alertOnCondition, title="Buy Alert", message='{"content": "Buy {{ticker}} at {{close}}"}')
alertcondition(sellCondition and alertOnCondition, title="Sell Alert", message='{"content": "Sell {{ticker}} at {{close}}"}')
alertcondition(signalBuyTPPrint and alertOnCondition, title="Buy TP Alert", message='{"content": "Buy TP {{ticker}} at {{close}}"}')
alertcondition(signalSellTPPrint and alertOnCondition, title="Sell TP Alert", message='{"content": "Sell TP {{ticker}} at {{close}}"}')
alertcondition(signalBuySLPrint and alertOnCondition, title="Buy SL Alert", message='{"content": "Buy SL {{ticker}} at {{close}}"}')
alertcondition(signalSellSLPrint and alertOnCondition, title="Sell SL Alert", message='{"content": "Sell SL {{ticker}} at {{close}}"}')

if buyCondition
    strategy.entry("Enter Long", strategy.long)
else if sellCondition
    strategy.entry("Enter Short", strategy.short)