1
پر توجہ دیں
1750
پیروکار
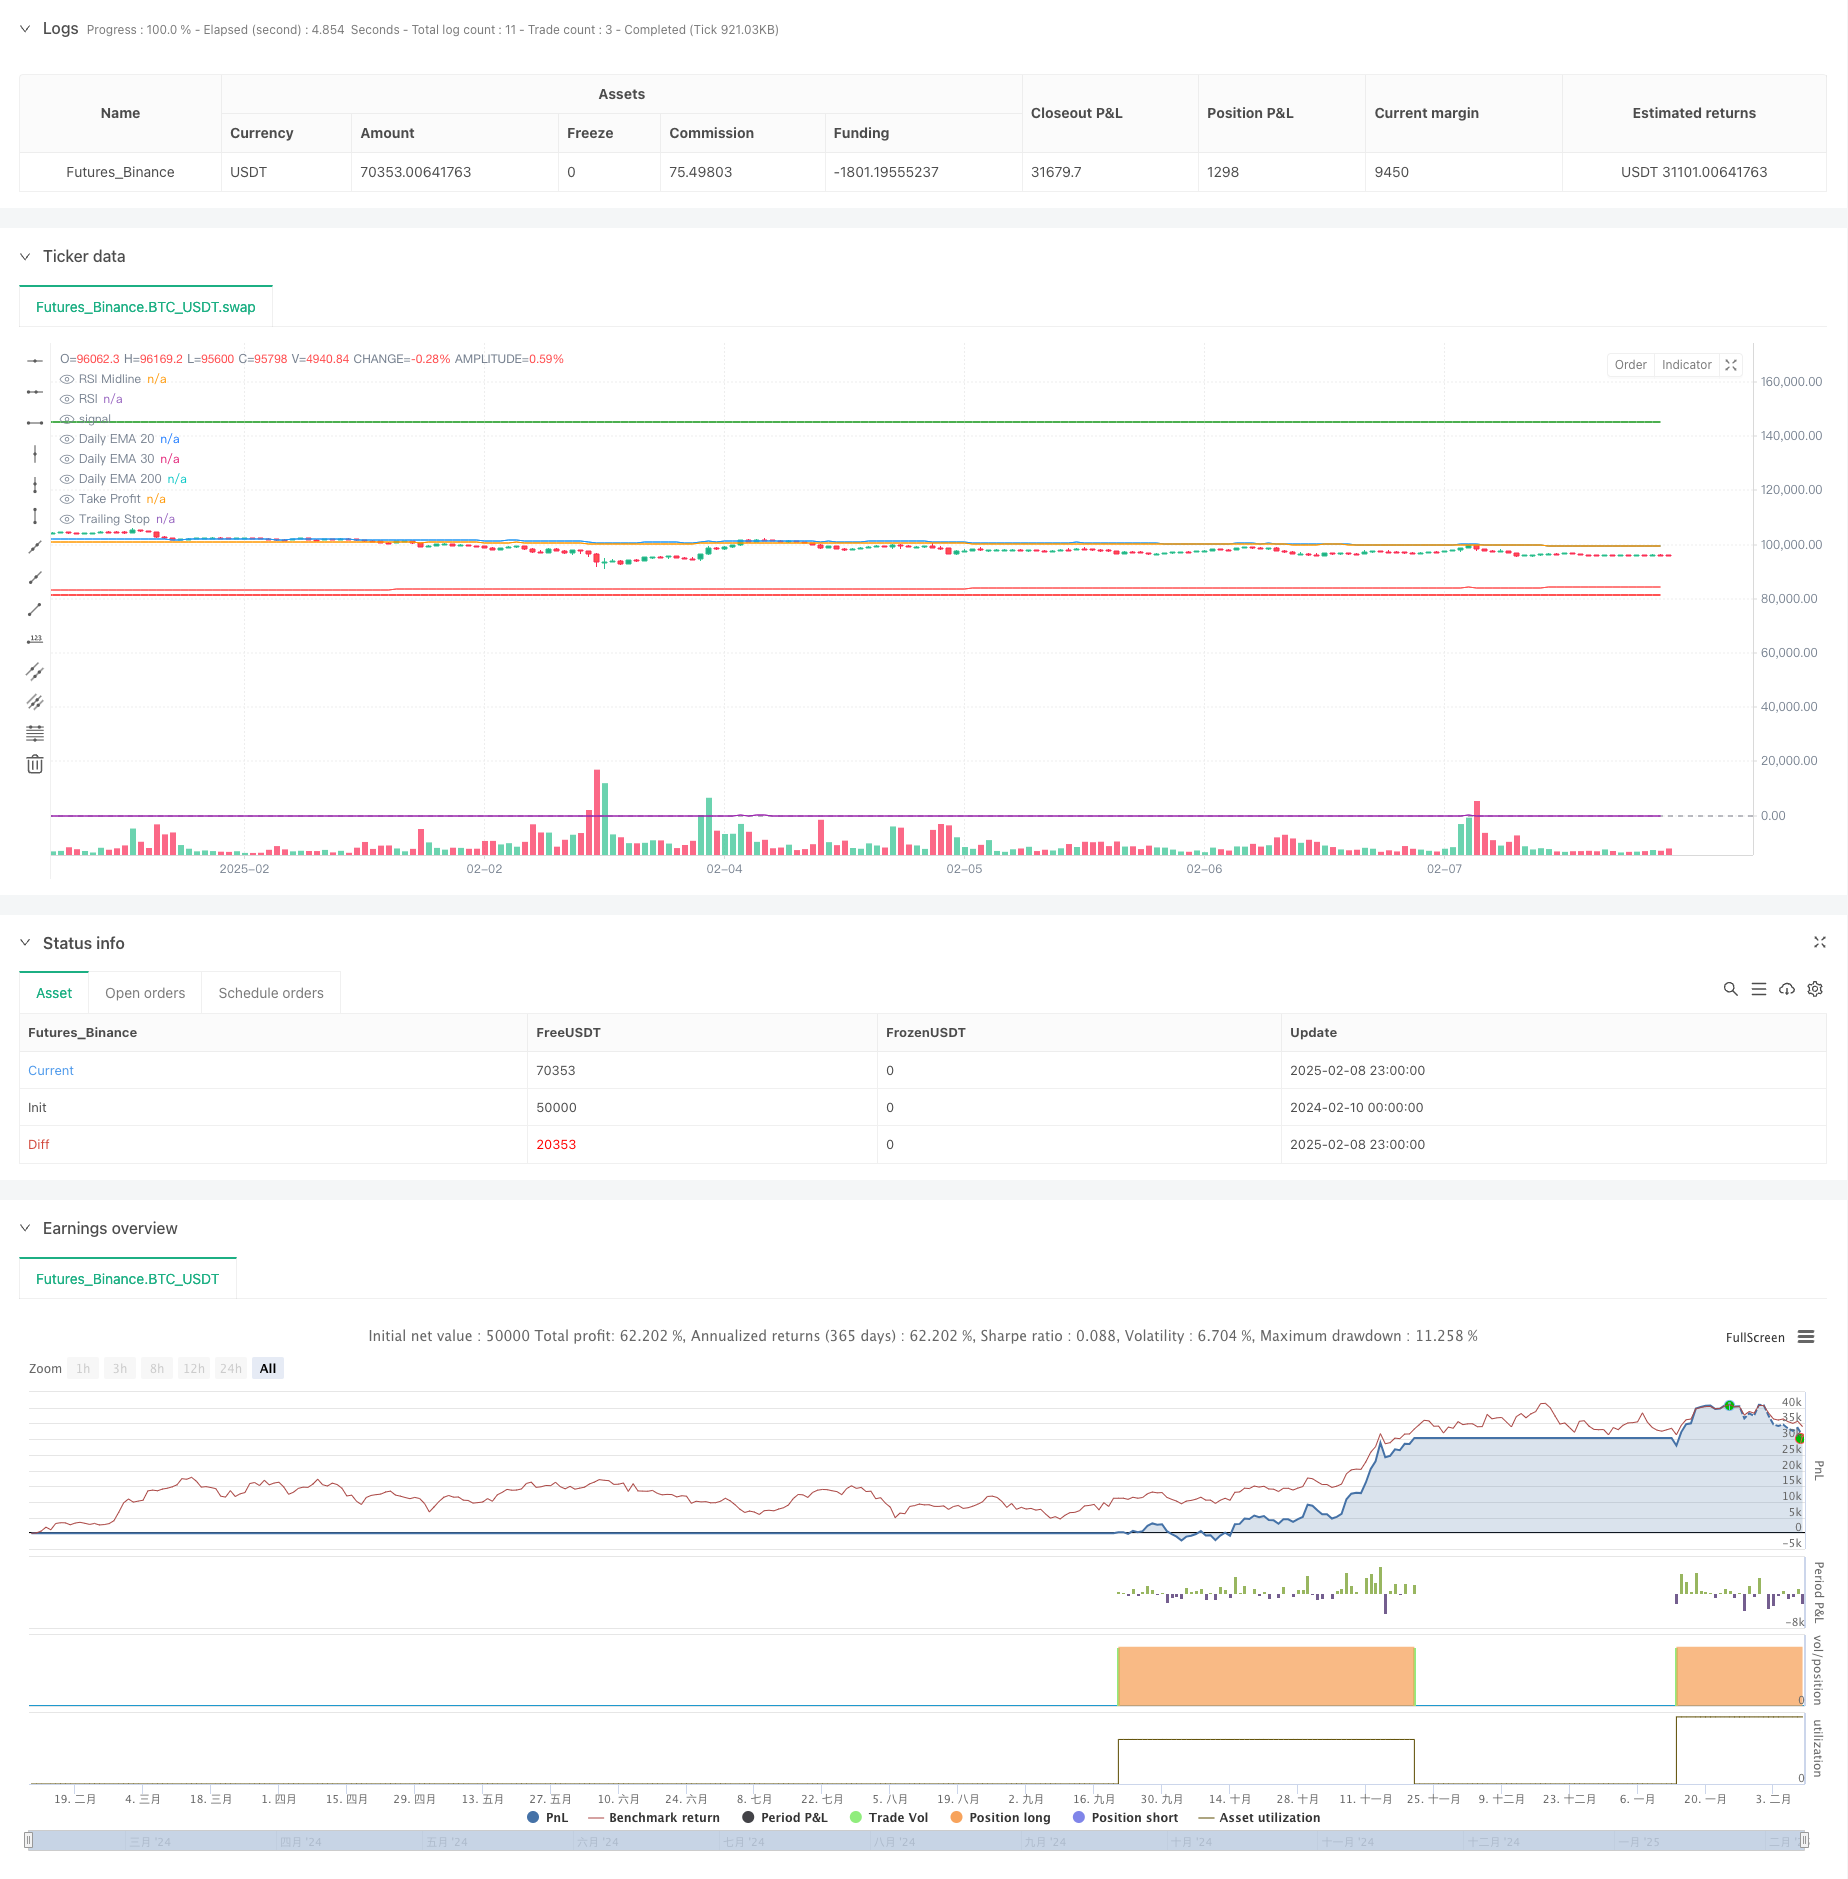
جائزہ
یہ حکمت عملی ایک رجحان ٹریڈنگ سسٹم ہے جو ایک سے زیادہ اشاریہ منتقل اوسط ((EMA) اور نسبتا strong مضبوط اشارے ((RSI) پر مبنی ہے۔ حکمت عملی میں ای ایم اے (20، 30، 200) کراس سگنل ، آر ایس آئی کی متحرک تصدیق اور متحرک اسٹاپ نقصان کا طریقہ کار شامل ہے ، جس کا مقصد مارکیٹ میں طویل مدتی رجحان سازی کے مواقع کو پکڑنا ہے۔
حکمت عملی کا اصول
حکمت عملی کی بنیادی منطق میں درج ذیل کلیدی اجزاء شامل ہیں:
- انٹری سگنل: جب دن کی لکیر 20 دن کی ای ایم اے اوپر کی طرف 30 دن کی ای ایم اے کو عبور کرتی ہے اور قیمت 200 دن کی ای ایم اے سے اوپر ہے اور RSI 50 سے زیادہ ہے تو ، نظام ایک کثیر سگنل پیدا کرتا ہے۔
- اسٹاپ سیٹنگ: داخلے کے بعد 50٪ فکسڈ اسٹاپ سیٹنگ۔
- متحرک اسٹاپ: 25٪ متحرک ٹریکنگ اسٹاپ کا استعمال کرتے ہوئے ، قیمت کی جدت طرازی کے ساتھ اسٹاپ کی پوزیشن کو اوپر کی طرف منتقل کریں۔
- باہر نکلنے کا طریقہ کار: جب قیمت اسٹاپ پوزیشن یا ٹریکنگ اسٹاپ نقصان کی جگہ کو چھوتی ہے تو ، خود بخود صفائی کی تجارت ختم ہوجاتی ہے۔
اسٹریٹجک فوائد
- ایک سے زیادہ ٹائم سائیکل کی توثیق: مختصر مدت کے اتار چڑھاؤ کو فلٹر کرنے کے لئے اور تجارت کی استحکام کو بڑھانے کے لئے یومیہ لائن کی سطح پر اوسط لائن کا مجموعہ۔
- متحرک رسک مینجمنٹ: ٹریکنگ اسٹاپ نقصان کا طریقہ کار منافع کو مؤثر طریقے سے بند کرنے اور بڑے پیمانے پر واپسی سے بچنے میں مدد کرتا ہے۔
- کافی حد تک رجحانات کی تصدیق: RSI اشارے ، اوسط لائن کے نظام کے ساتھ مل کر ، رجحانات کی افادیت کی بہتر طور پر تصدیق کرسکتے ہیں۔
- لاجسٹک کی وضاحت: داخلے اور باہر نکلنے کی شرائط واضح ہیں ، سمجھنے اور چلانے میں آسان ہیں۔
اسٹریٹجک رسک
- زلزلے کی مارکیٹ کا خطرہ: زلزلے کی مارکیٹس میں اکثر اسٹاپ نقصانات کا سامنا کرنا پڑتا ہے۔
- سلائڈ پوائنٹ کا اثر: مارکیٹ میں شدید اتار چڑھاو کے دوران ، متحرک اسٹاپ اور اسٹاپ پوزیشنوں کو زیادہ سلائڈ کا سامنا کرنا پڑ سکتا ہے۔
- جعلی توڑنے کا خطرہ: مساوی لائن کراس سگنل جعلی توڑنے کا خطرہ ہوسکتا ہے۔
- پیرامیٹر حساسیت: سٹاپ نقصان اور سٹاپ اسٹاپ فیصد کی ترتیبات حکمت عملی کی کارکردگی پر زیادہ اثر ڈالتی ہیں۔
حکمت عملی کی اصلاح کی سمت
- مارکیٹ کے حالات فلٹر: مارکیٹ کے حالات کا فیصلہ کرنے کے لئے اتار چڑھاؤ کی شرح کے اشارے (جیسے اے ٹی آر) شامل کیے جاسکتے ہیں ، اور چونکانے والی مارکیٹ میں پوزیشنوں کو کم کرسکتے ہیں یا تجارت کو روک سکتے ہیں۔
- اسٹاپ کو متحرک کرنا: اسٹاپ تناسب کو مارکیٹ کے اتار چڑھاو کے مطابق متحرک طور پر ایڈجسٹ کرنے پر غور کریں۔
- انٹری سگنل کی اصلاح: سگنل کی وشوسنییتا کو بہتر بنانے کے لئے مساوی لائن کراس سگنل کے ساتھ کام کرنے کے لئے ٹرانسمیشن اشارے متعارف کرایا جاسکتا ہے۔
- پوزیشن مینجمنٹ کو بہتر بنائیں: متحرک پوزیشن مینجمنٹ میکانزم متعارف کرایا گیا ہے ، جو مارکیٹ کے خطرے کے مطابق پوزیشن کھولنے کے پیمانے کو خود بخود ایڈجسٹ کرتا ہے۔
خلاصہ کریں۔
یہ حکمت عملی متعدد تکنیکی اشارے کے ہم آہنگی کے ساتھ مل کر ایک مکمل رجحان ٹریکنگ ٹریڈنگ سسٹم بناتی ہے۔ حکمت عملی کی اہم خصوصیت درمیانی اور طویل مدتی رجحانات کا فیصلہ اور متحرک خطرے کے کنٹرول کا امتزاج ہے ، جو رجحانات کی واضح مارکیٹ کے ماحول میں کام کرنے کے لئے موزوں ہے۔ مسلسل اصلاح اور بہتری کے ذریعہ ، حکمت عملی کو حقیقی تجارت میں بہتر کارکردگی کا مظاہرہ کرنے کی امید ہے۔
حکمت عملی کا ماخذ کوڈ
/*backtest
start: 2024-02-10 00:00:00
end: 2025-02-09 00:00:00
period: 1h
basePeriod: 1h
exchanges: [{"eid":"Futures_Binance","currency":"BTC_USDT"}]
*/

//@version=5
strategy("Talbuaia Signal", overlay=true)

// Request EMAs on the daily timeframe
ema20_daily = request.security(syminfo.tickerid, "D", ta.ema(close, 20), lookahead=barmerge.lookahead_on)
ema30_daily = request.security(syminfo.tickerid, "D", ta.ema(close, 30), lookahead=barmerge.lookahead_on)
ema200_daily = request.security(syminfo.tickerid, "D", ta.ema(close, 200), lookahead=barmerge.lookahead_on)

// RSI Calculation
rsi = ta.rsi(close, 14)

// Plot daily EMAs
plot(ema20_daily, color=color.blue, title="Daily EMA 20")
plot(ema30_daily, color=color.orange, title="Daily EMA 30")
plot(ema200_daily, color=color.red, title="Daily EMA 200")

// Plot RSI
hline(50, "RSI Midline", color=color.gray)
plot(rsi, color=color.purple, title="RSI")

// Entry condition: 20 EMA crosses above 30 EMA, price is above 200 EMA, and RSI > 50
bullishEntry = ta.crossover(ema20_daily, ema30_daily) and close > ema200_daily and rsi > 50

// Variables to track entry price, take profit, and trailing stop
var float entryPriceLong = na
var float highestPriceSinceEntry = na
var float takeProfitLevel = na
var float trailingStopLevel = na

// Entry Logic
if bullishEntry
    strategy.entry("Long", strategy.long)
    entryPriceLong := close
    highestPriceSinceEntry := close  // Initialize the highest price since entry
    takeProfitLevel := entryPriceLong * 1.50  // Set take profit at 50% above entry price
    trailingStopLevel := na  // Reset trailing stop
    label.new(bar_index, close, "BUY", style=label.style_label_up, color=color.green, textcolor=color.white)

// Update highest price and trailing stop dynamically
if strategy.position_size > 0
    highestPriceSinceEntry := math.max(highestPriceSinceEntry, close)  // Track the highest price reached
    trailingStopLevel := highestPriceSinceEntry * (1 - 0.25)  // Set trailing stop at 25% below the highest price

// Exit Logic: Take profit or trailing stop
if strategy.position_size > 0 and (close >= takeProfitLevel or close <= trailingStopLevel)
    strategy.close("Long")
    label.new(bar_index, close, "EXIT LONG", style=label.style_label_down, color=color.red, textcolor=color.white)

// Plot trailing stop and take profit levels on the chart
plot(trailingStopLevel, "Trailing Stop", color=color.red, linewidth=2, style=plot.style_line)
plot(takeProfitLevel, "Take Profit", color=color.green, linewidth=2, style=plot.style_line)