
جائزہ
یہ ایک ٹرپل میڈین لائن ٹرینڈ ٹریکنگ حکمت عملی ہے جو اولیور ویلیز ٹریڈنگ کے طریقہ کار پر مبنی ہے۔ اس حکمت عملی میں مارکیٹ کے رجحانات اور تجارتی مواقع کی نشاندہی کرنے کے لئے 20 ، 50 اور 200 دوروں کی متحرک اوسط کے کراس سگنل کا استعمال کیا جاتا ہے۔ 200 میڈین لائن ایک اہم رجحان فلٹر کے طور پر کام کرتی ہے ، جبکہ 20 اور 50 میڈین لائنوں کے کراس کو مخصوص تجارتی سگنل پیدا کرنے کے لئے استعمال کیا جاتا ہے۔ حکمت عملی میں خطرے کے انتظام کی خصوصیات شامل ہیں ، بشمول اسٹاپ نقصان اور اسٹاپ سیٹنگ۔
حکمت عملی کا اصول
اس حکمت عملی کی بنیادی منطق میں تین اہم پہلو شامل ہیں:
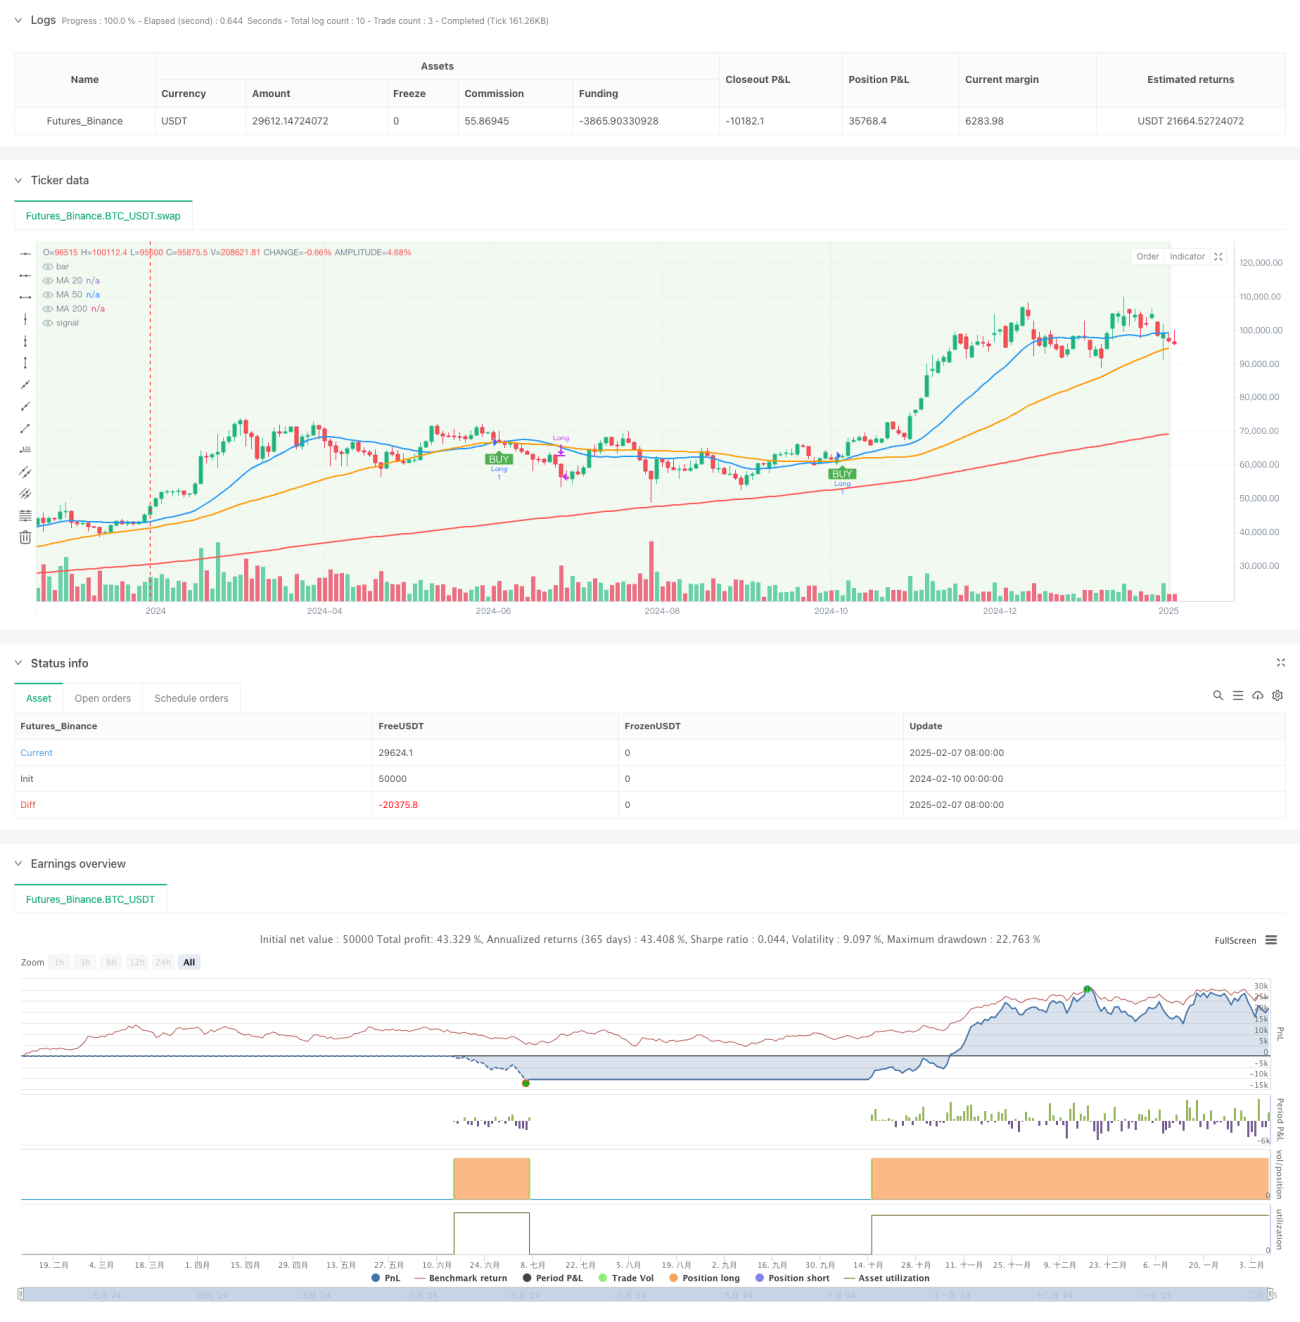
- رجحان کی شناخت: 200 کی اوسط اوسط لائن کو رجحان کی حد بندی کے طور پر استعمال کریں۔ جب قیمت 200 کی اوسط سے اوپر ہو تو ، اسے اوپر کی طرف رجحان سمجھا جاتا ہے۔ جب قیمت 200 کی اوسط سے نیچے ہو تو ، اسے نیچے کی طرف رجحان سمجھا جاتا ہے۔
- ٹریڈنگ سگنل: ایک بڑھتے ہوئے رجحان میں ، جب 20 کی اوسط اوسط لائن 50 کی اوسط لائن کو اوپر سے عبور کرتی ہے تو ، ایک کثیر سگنل کو متحرک کیا جاتا ہے۔ ایک گرنے والے رجحان میں ، جب 20 کی اوسط لائن 50 کی اوسط لائن کو نیچے سے عبور کرتی ہے تو ، ایک خالی سگنل کو متحرک کیا جاتا ہے۔
- خطرے پر قابو پانا: حکمت عملی میں 2٪ اسٹاپ اور 4٪ اسٹاپ اسٹاپ کا ڈیفالٹ سیٹ کیا گیا ہے ، اور جب ریورس کراس سگنل ہوتا ہے تو خود بخود صفائی ہوجاتی ہے۔
اسٹریٹجک فوائد
- ایک سے زیادہ تصدیق کا طریقہ کار: تین لائنوں کے ایک ساتھ استعمال کے ذریعے ، زیادہ قابل اعتماد ٹریڈنگ سگنل فراہم کرتا ہے۔
- رجحان فلٹرنگ: 200 یکساں رجحان فلٹرنگ کی خصوصیت مؤثر طریقے سے جعلی توڑنے کے خطرے کو کم کرتی ہے۔
- لچکدار: SMA اور EMA کے درمیان سوئچنگ کی حمایت کرتا ہے ، پیرامیٹرز کو مختلف مارکیٹ کی خصوصیات کے مطابق ایڈجسٹ کیا جاسکتا ہے۔
- بہتر خطرے کا انتظام: بلٹ میں نقصان کی روک تھام کا طریقہ کار ، فنڈز کی حفاظت۔
- بصری اثر: پس منظر کے رنگ میں تبدیلی کے ذریعے رجحان کی حالت کو ظاہر کرتا ہے۔
اسٹریٹجک رسک
- تاخیر: حرکت پذیر اوسط بنیادی طور پر ایک تاخیر کا اشارہ ہے ، جس کی وجہ سے داخلے یا باہر نکلنے کے وقت میں معمولی تاخیر ہوسکتی ہے۔
- زلزلے کی مارکیٹ پر لاگو نہیں ہوتا ہے: بار بار مساوی لائن کراسنگ غلط سگنل پیدا کر سکتا ہے.
- فکسڈ سٹاپ نقصان کا خطرہ: فکسڈ فی صد سٹاپ نقصان کا استعمال تمام مارکیٹ کے حالات کے لئے موزوں نہیں ہوسکتا ہے۔
- پیرامیٹرز کی حساسیت: مختلف اوسط مدت کی ترتیبات نمایاں طور پر مختلف نتائج پیدا کرسکتے ہیں۔
حکمت عملی کی اصلاح کی سمت
- ٹرانزیکشن تجزیہ متعارف کرایا: ٹرانزیکشن کی تصدیق کے اشارے شامل کیے جاسکتے ہیں ، جس سے سگنل کی وشوسنییتا میں اضافہ ہوتا ہے۔
- متحرک سٹاپ نقصان کی ترتیب: اے ٹی آر یا اتار چڑھاؤ کی شرح کے اشارے کا استعمال کرتے ہوئے متحرک طور پر سٹاپ نقصان کی پوزیشن کو ایڈجسٹ کرنے پر غور کریں۔
- رجحان کی طاقت فلٹر کو بڑھانا: رجحان کی طاقت کے اشارے جیسے ADX کو متعارف کرایا جاسکتا ہے ، جو کمزور رجحان والے ماحول کو فلٹر کرتا ہے۔
- انٹری ٹائمنگ کو بہتر بنائیں: قیمت کی شکل اور معاون مزاحمت کی سطح کے ساتھ مل کر ، انٹری کی درستگی کو بہتر بنائیں۔
- ٹائم فلٹر شامل کریں: ٹریڈنگ ٹائم ونڈوز کو زیادہ اتار چڑھاؤ کے اوقات سے بچنے کے لئے ترتیب دیا جاسکتا ہے۔
خلاصہ کریں۔
یہ ایک منظم ، منطقی اور واضح رجحان کی پیروی کرنے والی حکمت عملی ہے۔ ٹرپل میڈین لائن کے باہمی تعاون سے ، رجحانات کی شناخت کی درستگی کو یقینی بنایا گیا ہے اور واضح تجارتی سگنل فراہم کیے گئے ہیں۔ حکمت عملی کا رسک مینجمنٹ میکانزم نسبتا perfect کامل ہے ، لیکن اس میں ابھی بھی اصلاح کی گنجائش موجود ہے۔ یہ تجویز کیا گیا ہے کہ تاجر عملی طور پر استعمال کرنے سے پہلے بھرپور فیڈ بیک کریں ، اور پیرامیٹرز کی ترتیب کو مخصوص تجارتی اقسام کی خصوصیات کے مطابق ایڈجسٹ کریں۔
- 1