ڈبل موونگ ایوریج کراس اوور اور اسٹاکسٹک RSI اوور باٹ اور اوور سیلڈ رینج آپٹیمائزیشن ٹریڈنگ حکمت عملی

جائزہ
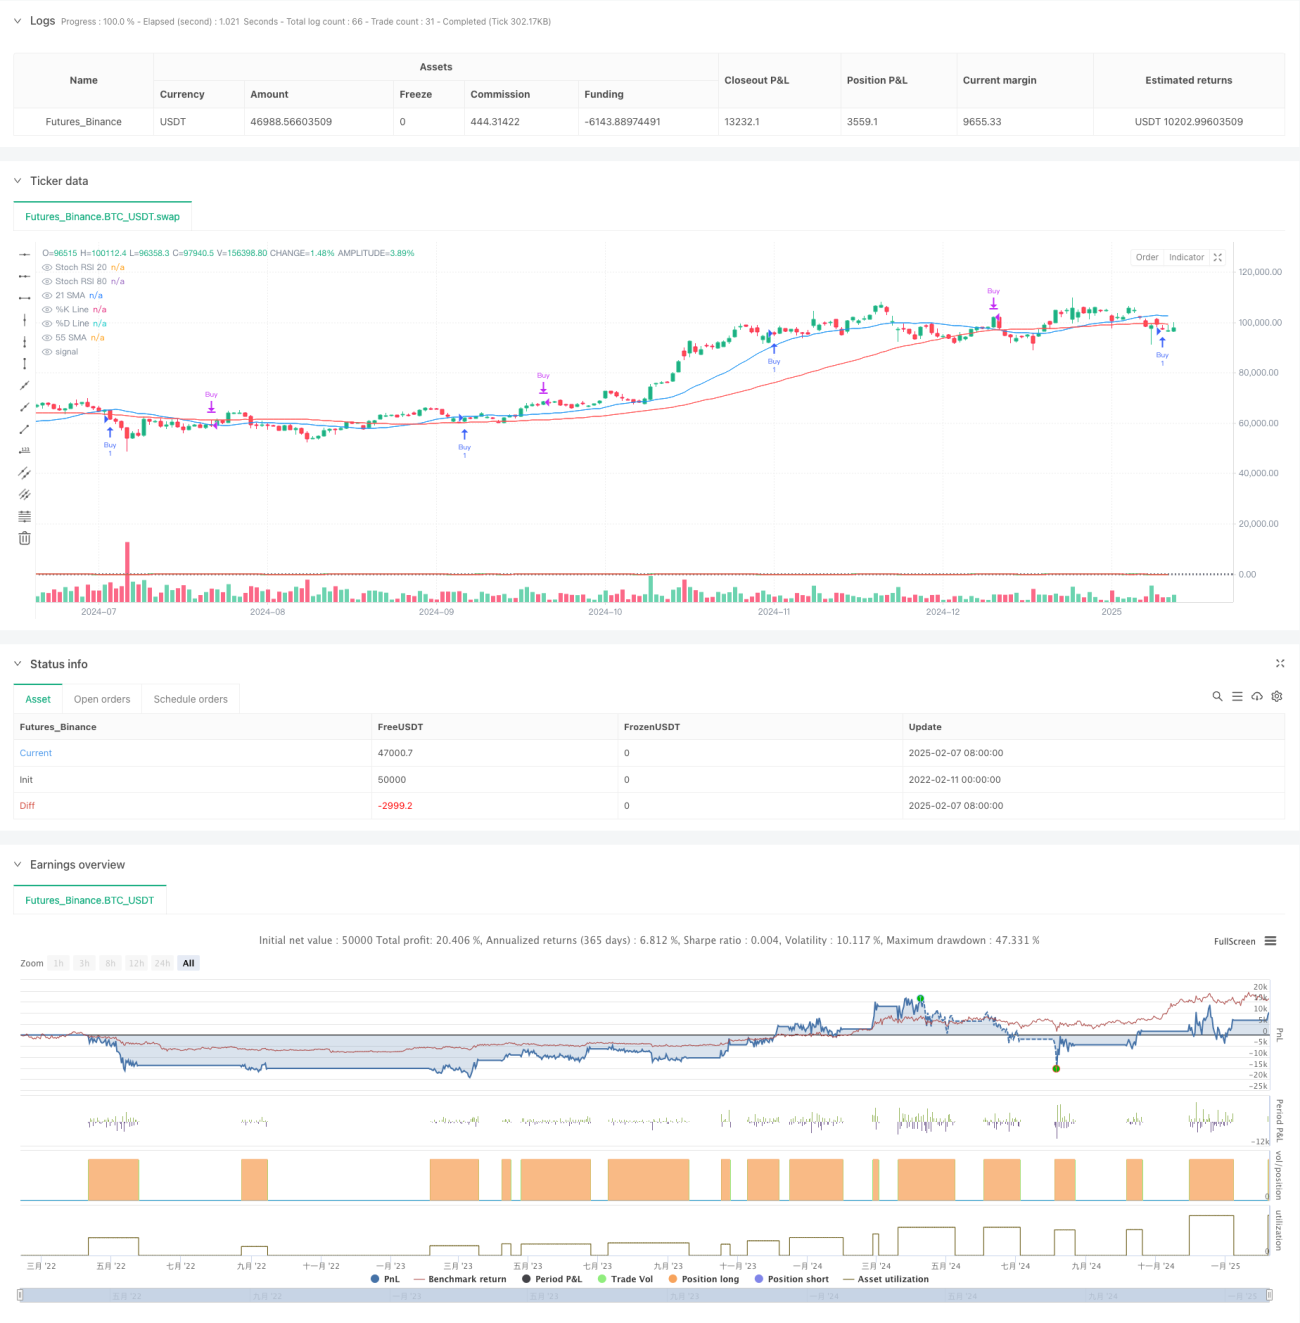
یہ حکمت عملی ایک ٹریڈنگ سسٹم ہے جو رجحانات کی پیروی کرتی ہے جس میں دوہری اوسط اور بے ترتیب آر ایس آئی اشارے شامل ہیں۔ مارکیٹ میں رجحانات کا اندازہ لگانے کے لئے 21 دوروں اور 55 دوروں کی سادہ حرکت پذیر اوسط کا استعمال کرتے ہوئے ، بے ترتیب آر ایس آئی کے اوور بیئر اوور سیل زون میں داخل ہونے اور باہر نکلنے کے لئے بہترین نقطہ نظر تلاش کرنے کے لئے ، رجحانات کی تجارت کو بہتر بنانے کے لئے استعمال کیا جاتا ہے۔ یہ حکمت عملی اوپر کی طرف رجحانات کی تصدیق کی بنیاد پر ، اوور سیل زون میں خریدنے کے مواقع کی تلاش میں ، اوور سیل زون میں فروخت کے مواقع کی تلاش میں ہے۔
حکمت عملی کا اصول
اس حکمت عملی کا بنیادی منطق یہ ہے:
- رجحان کی تصدیق: 21 سائیکل SMA اور 55 سائیکل SMA کا استعمال کرتے ہوئے ، جب قلیل مدتی اوسط طویل مدتی اوسط سے اوپر ہو تو ، اوپر کی طرف رجحان کی تصدیق کریں۔
- انٹری سگنل: رجحان کی تصدیق کے بعد ، بے ترتیب RSI کی K لائن کا انتظار کریں جو 20 سے نیچے کے اوور سیل علاقے میں D لائن کے ساتھ سنہری کراس تشکیل دے۔
- نکلنے کا اشارہ: جب بے ترتیب آر ایس آئی کی K لائن 80 سے زیادہ اوور بائڈ علاقوں میں ڈی لائن کے ساتھ ڈیڈ کراس تشکیل دیتی ہے تو ، خالی پوزیشن سے باہر نکلیں۔
- سگنل فلٹرنگ: رجحان اور حرکیات کے اشارے کے ساتھ مل کر ، جعلی سگنل کو مؤثر طریقے سے کم کریں۔
اسٹریٹجک فوائد
- ایک سے زیادہ تصدیق کے طریقہ کار: رجحانات اور حرکیات کی دوہری تصدیق کے ذریعے تجارت کی وشوسنییتا کو بہتر بنائیں۔
- خطرے کے کنٹرول کو بہتر بنانا: اوورلوپ اوورلوپ کے وقفے کا استعمال کرتے ہوئے ، رجحانات کی سمت میں بہتر داخلے کے مقامات کا انتخاب کریں۔
- لچکدار: حکمت عملی کے پیرامیٹرز کو مختلف مارکیٹ کی خصوصیات کے مطابق ایڈجسٹ کیا جاسکتا ہے۔
- سگنل واضح: داخلے اور باہر نکلنے کے حالات واضح ہیں اور ان پر عمل کرنا آسان ہے۔
- نظام سازی کی اعلی سطح: حکمت عملی کی منطق مکمل طور پر نظام سازی ہے ، جس میں ذہنی فیصلے کم ہیں۔
اسٹریٹجک رسک
- ہلچل مارکیٹ کا خطرہ: ہلچل والے بازاروں میں اکثر تجارت ہوسکتی ہے۔
- تاخیر کا خطرہ: متحرک اوسط کچھ تاخیر کا شکار ہے ، اور اس سے بہترین داخلے کا وقت ضائع ہوسکتا ہے۔
- غلط بریک کا خطرہ: بے ترتیب آر ایس آئی زلزلے کی منڈیوں میں غلط سگنل دے سکتا ہے۔
- پیرامیٹر کی حساسیت: مختلف پیرامیٹر کے امتزاج حکمت عملی کی کارکردگی میں بڑے فرق کا باعث بن سکتے ہیں۔
حکمت عملی کی اصلاح کی سمت
- اتار چڑھاؤ فلٹر شامل کریں: اے ٹی آر اشارے متعارف کروائیں ، کم اتار چڑھاؤ کے دوران تجارت کی کثرت کو کم کریں۔
- آؤٹ پٹ میکانیزم کو بہتر بنائیں: ایک متحرک سٹاپ نقصان یا منافع کا ہدف شامل کرنے پر غور کریں۔
- مارکیٹ کے ماحول کی درجہ بندی: مختلف مارکیٹ کے ماحول کی حرکیات کے مطابق ایڈجسٹ پیرامیٹرز۔
- ٹرانزیکشن کی توثیق میں اضافہ: ٹرانزیکشن کی توثیق کے اشارے کو شامل کریں تاکہ سگنل کی تاثیر کو درست کیا جاسکے۔
- رجحان کی طاقت کے اشارے متعارف کروائیں: جیسے کہ ADX ، کمزور رجحان والے ماحول کو فلٹر کرنے کے لئے۔
خلاصہ کریں۔
یہ حکمت عملی کلاسیکی تکنیکی اشارے کے ساتھ مل کر ایک مکمل رجحان ٹریکنگ ٹریڈنگ سسٹم بناتی ہے۔ حکمت عملی کو سادہ اور بدیہی رکھتے ہوئے ، متعدد سگنل کی تصدیق کے ذریعہ وشوسنییتا میں اضافہ کیا گیا ہے۔ معقول پیرامیٹرز کی اصلاح اور خطرے کے انتظام کے ذریعہ ، اس حکمت عملی کی عمدہ عملی قدر ہے۔ یہ تجویز کیا گیا ہے کہ تاجروں کو عملی طور پر استعمال کرنے سے پہلے کافی آراء کی جانچ پڑتال کی جائے اور پیرامیٹرز کو مارکیٹ کی مخصوص خصوصیات کے مطابق ایڈجسٹ کیا جائے۔
- 1