
جائزہ
یہ حکمت عملی ایک جدید رجحان ٹریکنگ ٹریڈنگ سسٹم ہے جس میں مارکیٹ کے رجحانات کی نشاندہی کرنے کے لئے دوہری انڈیکس ہموار کرنے کی تکنیک کا استعمال کیا جاتا ہے۔ یہ سسٹم قیمت کے اعداد و شمار پر خصوصی انڈیکس ہموار کرنے کے عمل سے دو رجحان لائنیں تیار کرتا ہے ، جو مارکیٹ میں قلیل مدتی اور طویل مدتی حرکت کو پکڑنے کے لئے استعمال کیا جاتا ہے۔ یہ نظام ایک مکمل رسک مینجمنٹ ماڈیول کے ساتھ مربوط ہے ، جس میں اسٹاپ اسٹاپ نقصان کی ترتیب ، اور لچکدار پوزیشن مینجمنٹ کی خصوصیات شامل ہیں۔
حکمت عملی کا اصول
اس حکمت عملی کا مرکز اس کی منفرد دو پرتوں والی اشاریہ ہموار الگورتھم ہے۔ سب سے پہلے ، نظام اختتامی قیمتوں پر وزن کا علاج کرتا ہے ، جس کا حساب کتاب ((اعلی ترین قیمت + کم ترین قیمت + 2)*اس طرح مارکیٹ کے شور کے اثرات کو کم کیا جاسکتا ہے۔ اس کے بعد ، اپنی مرضی کے مطابق اشاریہ ہموار کرنے والے افعال کے ذریعہ ، ہموار منحنی خطوط 9 اور 30 ادوار کے حساب سے حساب لگائے جاتے ہیں۔ جب قلیل مدتی منحنی خطوط طویل مدتی منحنی خطوط کو عبور کرتے ہیں تو ، نظام تجارتی سگنل پیدا کرتا ہے۔ اوپر کی طرف سے ایک سے زیادہ سگنل پیدا ہوتے ہیں ، نیچے کی طرف سے خالی سگنل پیدا ہوتے ہیں۔ اس نظام میں فیصد پر مبنی پوزیشن مینجمنٹ سسٹم بھی شامل ہے ، جو پہلے سے طے شدہ طور پر اکاؤنٹ میں 100٪ فنڈز کا استعمال کرتے ہوئے تجارت کرتا ہے۔
اسٹریٹجک فوائد
- سگنل جنریٹر واضح ہے، کلاسیکی رجحان ٹریکنگ تصورات کو اپنانے، سمجھنے اور لاگو کرنے میں آسان ہے.
- ڈبل پرت اشاریہ ہموار ٹیکنالوجی مارکیٹ شور کو مؤثر طریقے سے فلٹر کرتی ہے اور سگنل کی معیار کو بہتر بناتی ہے۔
- ایک مکمل خطرے کے انتظام کے نظام، بشمول سٹاپ نقصان اور پوزیشن مینجمنٹ کے ساتھ مربوط.
- نظام مختلف مارکیٹ کے حالات کے مطابق ڈھال سکتا ہے اور مختلف قسم کے لین دین کے لئے موزوں ہے۔
- واضح بصری اشارے فراہم کرتا ہے جو تاجروں کو تیزی سے مارکیٹ کی سمت کا تعین کرنے میں مدد دیتا ہے۔
اسٹریٹجک رسک
- ایک بار پھر ، ایک بار پھر ، ایک بار پھر ، ایک بار پھر ، ایک بار پھر ، ایک بار پھر ، ایک بار پھر ، ایک بار پھر ، ایک بار پھر۔
- ڈیفالٹ 100٪ فنڈ کے ساتھ تجارت کرنا ، زیادہ بیعانہ زیادہ خطرہ لا سکتا ہے۔
- ایک مقررہ پوائنٹ کے ساتھ اسٹاپ نقصان کی ترتیب تمام مارکیٹ کے حالات کے لئے موزوں نہیں ہوسکتی ہے۔
- سسٹم میں تیزی سے اتار چڑھاؤ والے بازاروں میں سلائڈ پوائنٹس ہوسکتے ہیں ، جو عملدرآمد کو متاثر کرتے ہیں۔
- ماضی کی جانچ پڑتال کے نتائج مستقبل کی کارکردگی کی ضمانت نہیں دے سکتے۔
حکمت عملی کی اصلاح کی سمت
- اتار چڑھاؤ کی شرح کے اشارے متعارف کرانے (جیسے اے ٹی آر) کو متحرک طور پر اسٹاپ اسٹاپ نقصان کی پوزیشن کو ایڈجسٹ کریں۔
- رجحان کی طاقت کے فلٹر کو بڑھانا اور کمزور رجحان کے ماحول میں تجارت کی تعدد کو کم کرنا۔
- مارکیٹ کے ماحول کی شناخت کے ماڈیول میں شامل کریں ، جو ہلچل والے بازاروں میں حکمت عملی کے پیرامیٹرز کو خود بخود ایڈجسٹ کرتا ہے۔
- متحرک پوزیشن مینجمنٹ سسٹم تیار کریں جو مارکیٹ کی صورتحال کے مطابق خود کار طریقے سے تجارت کے سائز کو ایڈجسٹ کرے۔
- بنیادی تجزیہ ماڈیولز کو مربوط کرنے کے لئے، ٹریڈنگ کے فیصلوں کی درستگی کو بہتر بنانے کے لئے.
خلاصہ کریں۔
یہ ایک ایسا ٹرینڈ ٹریکنگ سسٹم ہے جو معقول ، منطقی اور واضح طور پر ڈیزائن کیا گیا ہے۔ دوہری انڈیکس ہموار ٹیکنالوجی اور ایک مکمل رسک مینجمنٹ سسٹم کے ذریعہ ، یہ حکمت عملی رجحان کی منڈیوں میں اچھی کارکردگی کا مظاہرہ کرنے میں کامیاب ہے۔ تاہم ، صارفین کو اپنی خطرے کی برداشت کی صلاحیت کے مطابق پوزیشن کا سائز ایڈجسٹ کرنے کی ضرورت ہے ، اور یہ مشورہ دیا جاتا ہے کہ وہ جسمانی تجارت سے پہلے کافی جانچ پڑتال کریں۔ تجویز کردہ اصلاحی سمت کے ذریعہ ، اس حکمت عملی میں مزید بہتری کی گنجائش ہے۔
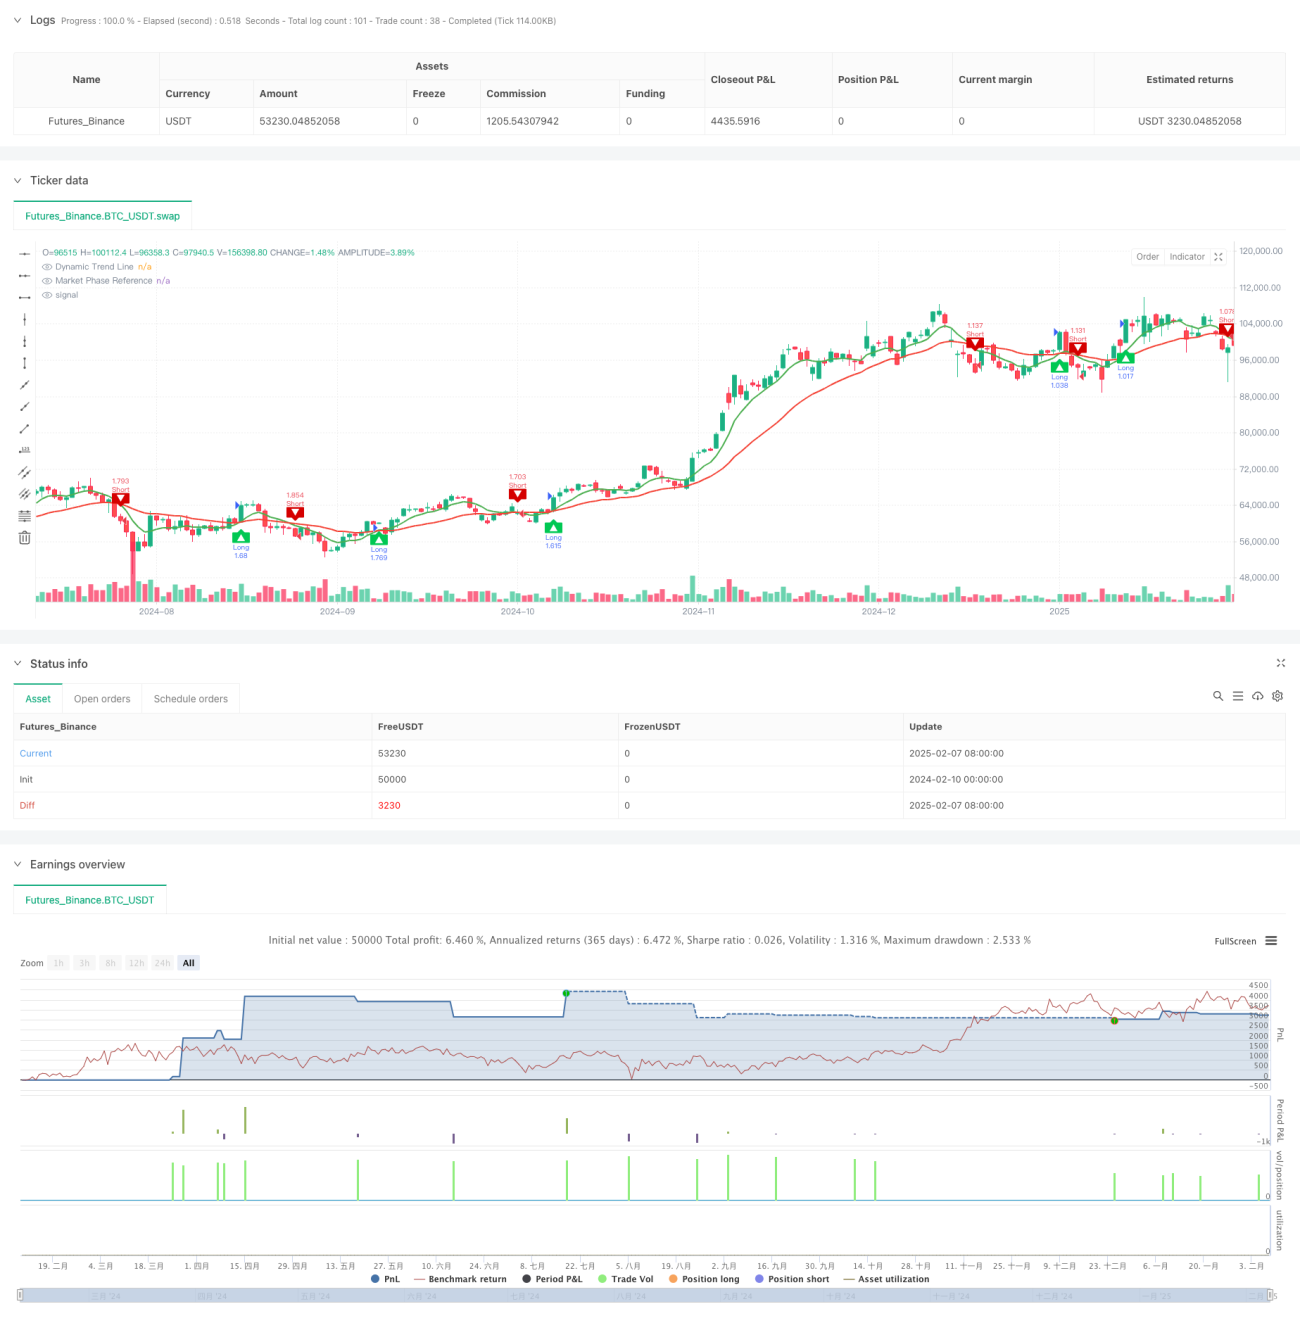
/*backtest
start: 2024-02-10 00:00:00
end: 2025-02-08 08:00:00
period: 1d
basePeriod: 1d
exchanges: [{"eid":"Futures_Binance","currency":"BTC_USDT"}]
*/

//@version=5
strategy("Dynamic Trend Navigator AI [CodingView]", overlay=true, initial_capital=100000, default_qty_type=strategy.percent_of_equity , default_qty_value=200 )
- 1