
جائزہ
یہ حکمت عملی ایک رجحان ٹریکنگ سسٹم ہے جس میں متعدد تکنیکی اشارے شامل ہیں ، جو ایک مکمل تجارتی فیصلہ سازی کا فریم ورک تشکیل دیتے ہیں ، جیسے کہ متحرک اوسط ((EMA) ، نسبتا strong مضبوط اشارے ((RSI) ، متحرک اوسط متغیر متغیر اشارے ((MACD) ، اور برلن بینڈ ((BB)) ۔ اس حکمت عملی میں متحرک رسک مینجمنٹ کا طریقہ کار استعمال کیا گیا ہے ، جس میں فیصد پر مبنی اسٹاپ نقصانات اور رسک پر مبنی منافع کے مقابلے میں اسٹاپ سیٹنگ شامل ہیں ، جس کا مقصد مستحکم اور صحت مند رسک ایڈجسٹمنٹ کے بعد منافع حاصل کرنا ہے۔
حکمت عملی کا اصول
اس حکمت عملی کی بنیادی منطق مارکیٹ کے تجزیہ پر مبنی ہے جس میں کئی سطحیں ہیں:
- رجحان کی تصدیق: 200 دن کے ای ایم اے کا استعمال کرتے ہوئے طویل مدتی رجحان کی سمت کا تعین کریں ، تیز رفتار ای ایم اے ((20 دن) اور سست رفتار ای ایم اے ((50 دن) کے درمیان درمیانی مدت کے رجحان میں تبدیلی کی تصدیق کریں
- متحرک توثیق: آر ایس آئی اشارے اور ایم اے سی ڈی کا استعمال کرتے ہوئے مارکیٹ کی نقل و حرکت کی دوہری توثیق کریں ، جس میں آر ایس آئی کو 50 سے اوپر (کثیر سر) یا 50 سے نیچے (خالی سر) کی ضرورت ہوتی ہے ، جبکہ ایم اے سی ڈی سگنل لائنیں اسی سمت کی حمایت کرتی ہیں
- اتار چڑھاؤ کنٹرول: بروئنگ بینڈ کے ذریعے تجارت کے وقت کا عین مطابق اندازہ لگانا ، نیچے کی حمایت کی پوزیشن پر زیادہ مواقع تلاش کرنا ، اور اوپر کی مزاحمت کی پوزیشن پر کم مواقع تلاش کرنا
- رسک مینجمنٹ: 2٪ اسٹاپ نقصان کی ترتیب اور 1.5x رسک کمائی کی شرح کی روک تھام کی سطح کا استعمال کرتے ہوئے ، ہر تجارت کے خطرے کو کنٹرول میں رکھنا یقینی بنائیں
اسٹریٹجک فوائد
- کثیر جہتی تجزیہ: رجحانات ، حرکیات اور اتار چڑھاؤ کے اشارے کو ملا کر جھوٹے سگنل کے اثرات کو کم کریں
- خطرے پر قابو پانا: اسٹاپ نقصان اور اسٹاپ کی سطح کو یقینی بناتا ہے کہ تجارت کا خطرہ قابو میں رہے
- لچکدار: حکمت عملی کے پیرامیٹرز کو مختلف مارکیٹ کے حالات کے مطابق ایڈجسٹ کیا جاسکتا ہے
- واضح نفاذ: داخلے اور باہر نکلنے کے شرائط واضح ، آسانی سے نافذ اور نگرانی
- فنڈ مینجمنٹ معقول: اکاؤنٹ کے حقوق و منافع کے فیصد کو پوزیشن کنٹرول کے طور پر استعمال کریں ، حد سے زیادہ خطرے سے بچیں
اسٹریٹجک رسک
- مارکیٹ میں اتار چڑھاؤ کا خطرہ: اعلی اتار چڑھاؤ کے دوران بار بار اسٹاپ نقصان کا سبب بن سکتا ہے
- رجحان کے الٹ جانے کا خطرہ: رجحان کے الٹ جانے کے مقام پر ایک بڑی واپسی کا امکان ہے
- پیرامیٹر کی اصلاح کا خطرہ: حد سے زیادہ اصلاح کرنا اوور فٹنگ کا باعث بن سکتا ہے۔
- اسکیلپنگ کا خطرہ: کم لیکویڈیٹی کے ساتھ زیادہ اسکیلپنگ کا خطرہ ہوسکتا ہے
- کمیشن کے اخراجات کا خطرہ: بار بار تجارت سے اعلی قیمتوں میں تجارت ہوسکتی ہے
حکمت عملی کی اصلاح کی سمت
- متحرک پیرامیٹرز ایڈجسٹمنٹ: مارکیٹ میں اتار چڑھاؤ کی شرح کے مطابق اشارے کے پیرامیٹرز کو خود بخود ایڈجسٹ کیا جاسکتا ہے
- مارکیٹ کے جذبات کے اشارے بڑھانا: ٹرانزیکشن حجم جیسے اشارے متعارف کرانے سے سگنل کی وشوسنییتا میں اضافہ ہوتا ہے
- نقصانات کو روکنے کے طریقہ کار کو بہتر بنانا: نقصانات کو روکنے اور منافع کی حفاظت کو بہتر بنانا
- ٹائم فلٹرنگ متعارف کروائیں: ٹرانزیکشن ٹائم ونڈوز میں اضافہ کریں
- اتار چڑھاؤ فلٹر شامل کریں: زیادہ اتار چڑھاؤ کے دوران پوزیشنوں کو کم کریں یا تجارت کو معطل کریں
خلاصہ کریں۔
اس حکمت عملی نے متعدد تکنیکی اشارے کے مربوط استعمال کے ذریعے ایک مکمل رجحان ٹریکنگ ٹریڈنگ سسٹم تشکیل دیا ہے۔ سخت رسک مینجمنٹ اور کثیر جہتی مارکیٹ تجزیہ کے ذریعہ ، حکمت عملی میں بہتر موافقت اور استحکام ہے۔ اگرچہ کچھ اصلاحات کی گنجائش موجود ہے ، لیکن مجموعی طور پر فریم ورک ڈیزائن معقول ہے اور درمیانی اور طویل مدتی تجارتی حکمت عملی کی بنیاد پر موزوں ہے۔ حکمت عملی کے کامیاب نفاذ کے لئے مسلسل نگرانی اور مختلف مارکیٹ کے حالات کے مطابق بروقت پیرامیٹرز کی ایڈجسٹمنٹ کی ضرورت ہے۔
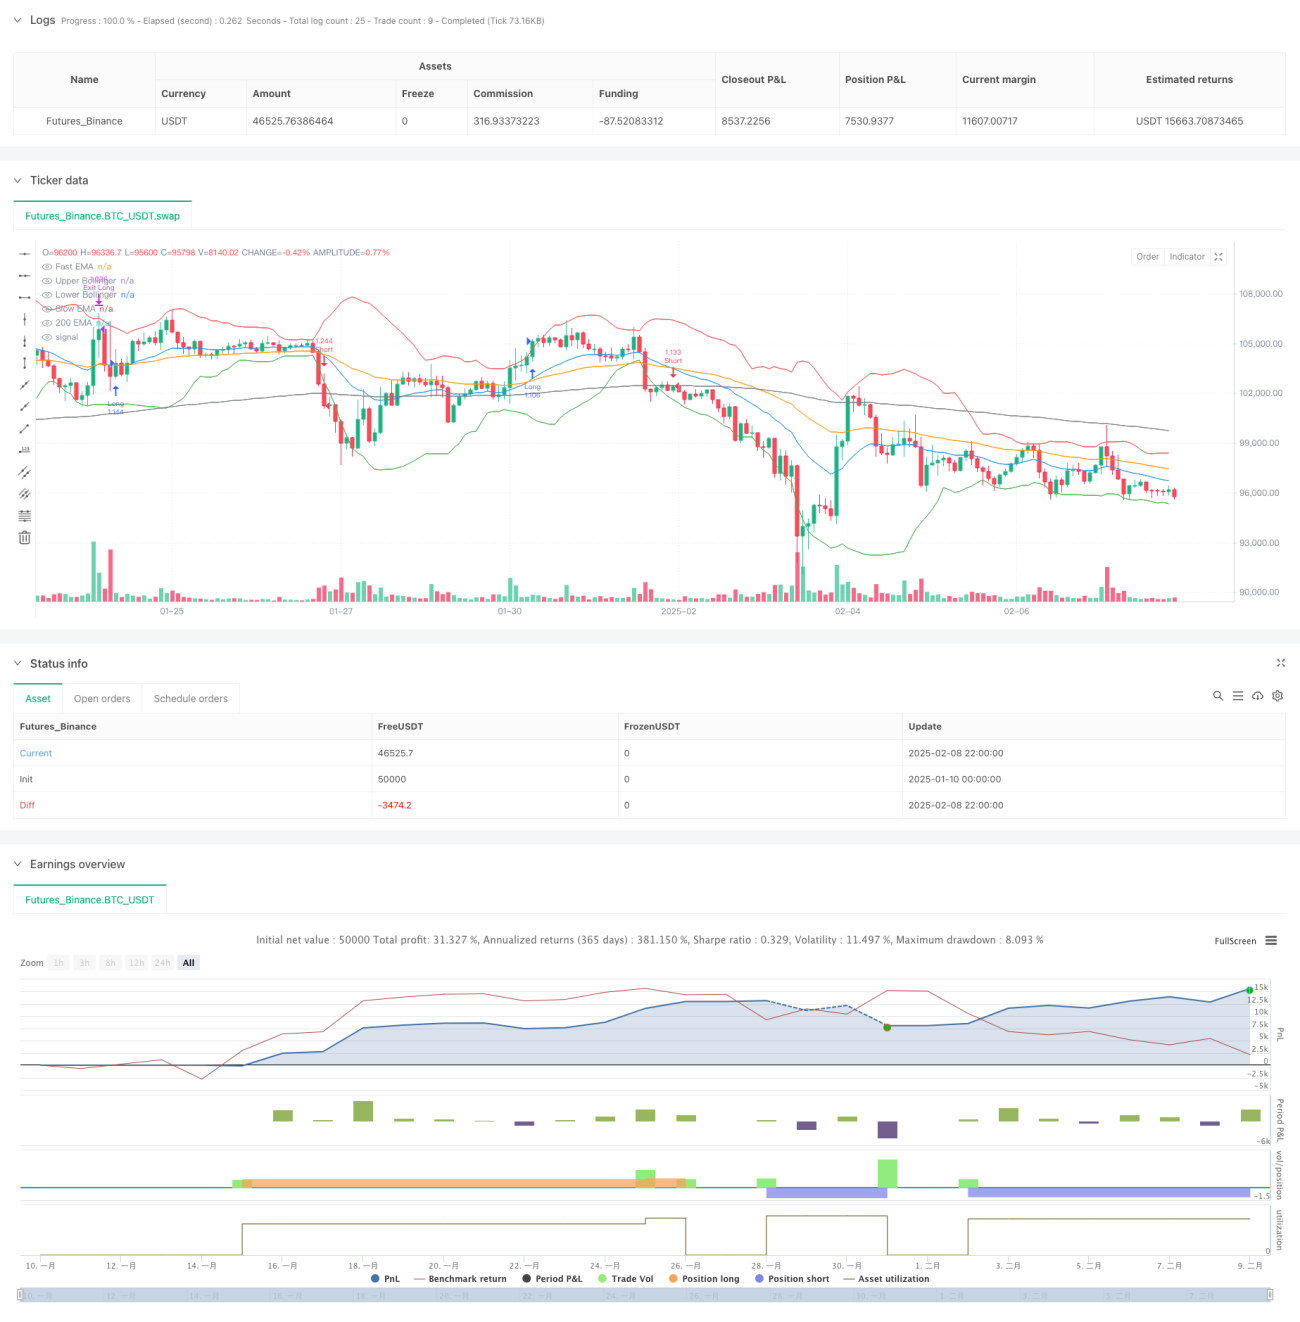
/*backtest
start: 2025-01-10 00:00:00
end: 2025-02-09 00:00:00
period: 2h
basePeriod: 2h
exchanges: [{"eid":"Futures_Binance","currency":"BTC_USDT"}]
*/

//@version=5
strategy("Altcoin Long/Short Strategy", overlay=true, initial_capital=1000, default_qty_type=strategy.percent_of_equity, default_qty_value=200, commission_type=strategy.commission.percent, commission_value=0.1)

// —————— Inputs ——————- 1