ٹرینڈ مومنٹم اسٹریٹجی - زگ زیگ ملٹی پیریڈ ڈائنامک بینڈ ٹائمنگ سسٹم

جائزہ
یہ حکمت عملی ایک کثیر جہتی تجارتی نظام ہے جس میں زیگ زیگ اشارے اور ولیم اشارے شامل ہیں۔ اس کے ذریعہ اہم طول و عرض کی اونچائی اور کم کی نشاندہی کی جاتی ہے ، اور اس کے ساتھ ہی ولیم اشارے کو استعمال کیا جاتا ہے جب مارکیٹ میں زیادہ خرید یا زیادہ فروخت کی حالت ہوتی ہے۔ یہ مجموعہ نہ صرف مارکیٹ کے اہم رجحانات کو پکڑنے کے قابل ہے ، بلکہ اس کی رفتار کی تصدیق کے ذریعہ تجارت کی درستگی کو بہتر بناتا ہے۔
حکمت عملی کا اصول
اس حکمت عملی کی بنیادی منطق دو اہم اجزاء پر مبنی ہے:
- لفظی اشارے ایک مقررہ گہرائی اور انحراف کے پیرامیٹرز کے ذریعہ نمایاں طول و عرض کے اعلی اور نچلے مقامات کی نشاندہی کرتے ہیں ، مارکیٹ کے شور کو فلٹر کرتے ہیں ، اور رجحان کی سمت کا تعین کرتے ہیں۔ جب ایک نیا طول و عرض کم ہوتا ہے تو اس کا اشارہ ہوتا ہے کہ اوپر کا رجحان شروع ہوتا ہے ، اور ایک نیا طول و عرض اونچائی کا اشارہ ہوتا ہے کہ نیچے کا رجحان شروع ہوتا ہے۔
- ولیم انڈیکس موجودہ قیمتوں کا موازنہ کسی خاص دورانیے میں سب سے زیادہ قیمتوں کے ساتھ کرکے مارکیٹ کی متحرک حالت کا حساب لگاتا ہے۔ جب اشارے کی قیمت 80 سے تجاوز کرتی ہے تو اس کا مطلب ہے کہ اس سے زیادہ فروخت (امکانی خریدنے کا موقع) اور 20 سے تجاوز کرنا اس کا مطلب ہے کہ اس سے زیادہ خریدنا (امکانی فروخت کا موقع) ۔
حکمت عملی کے لئے ٹریڈنگ کے قواعد مندرجہ ذیل ہیں:
- متعدد شرائط بنائیں: لفظی اشارے نے ایک نئی کم حد کی نشاندہی کی اور ولیم اشارے نے oversold علاقے سے اوپر کی طرف توڑ دیا
- خالی کرنے کی شرائط: لفظی اشارے نے نئے بینڈ کی اونچائی کی نشاندہی کی اور ولیم اشارے نے اوور بائڈ علاقے سے نیچے کی طرف توڑ دیا
- سٹاپ نقصان 1٪ اور سٹاپ نقصان 2٪
اسٹریٹجک فوائد
- کثیر جہتی تصدیق: رجحانات اور حرکیات کی دوہری تصدیق کے ذریعہ تجارتی سگنل کی وشوسنییتا میں اضافہ
- خود کو اپنانے کی صلاحیت: لفظی اشارے کے انحراف پیرامیٹرز کو مارکیٹ کی اتار چڑھاؤ کی رفتار کے مطابق ایڈجسٹ کیا جاسکتا ہے
- بہتر خطرے کا کنٹرول: ہر تجارت کے خطرے کو کنٹرول کرنے کے لئے مقررہ فیصد سٹاپ نقصان کی حکمت عملی کا استعمال کریں
- بہتر بصری اثرات: تجزیہ اور اصلاح کے لئے ٹریڈنگ سگنل کو واضح طور پر ٹیگ اور گرافکس کے ذریعہ دکھائیں
اسٹریٹجک رسک
- مارکیٹ میں ہلچل کا خطرہ: اکثر غلط بریک سگنل کا امکان
- سلائڈ پوائنٹ کا خطرہ: تیز رفتار سفر میں زیادہ سلائڈ پوائنٹس کا سامنا کرنا پڑ سکتا ہے
- پیرامیٹر حساسیت: اشارے کے پیرامیٹرز کا انتخاب حکمت عملی کی کارکردگی پر زیادہ اثر ڈالتا ہے
- سگنل کی تاخیر: نئے بینڈوڈتھ پوائنٹس کی تشکیل کی تصدیق کرنے کی ضرورت کی وجہ سے کچھ تیز رفتار واقعات سے محروم ہوسکتے ہیں
حکمت عملی کی اصلاح کی سمت
- مارکیٹ کے حالات کی فلٹرنگ میں اضافہ: مارکیٹ کی حالت کی شناخت کے لئے اتار چڑھاؤ کے اشارے شامل کیے جاسکتے ہیں ، مختلف ماحول میں مختلف پیرامیٹرز کی ترتیبات کا استعمال کرتے ہوئے
- متحرک اسٹاپ نقصان کی اصلاح: اے ٹی آر یا اتار چڑھاؤ کی شرح کی بنیاد پر اسٹاپ نقصان کی پوزیشن کو متحرک طور پر ایڈجسٹ کیا جاسکتا ہے
- ٹرانزیکشن کی تصدیق متعارف کرایا: سگنل کی پیداوار پر ٹرانزیکشن کی توثیق میں اضافہ
- ٹائم فلٹر: ٹریڈنگ کے وقت کے فلٹر کو شامل کیا جاسکتا ہے تاکہ زیادہ اتار چڑھاؤ کے اوقات میں تجارت سے بچا جاسکے
خلاصہ کریں۔
یہ ایک مکمل ٹریڈنگ سسٹم ہے جو رجحانات کی پیروی اور متحرک تجارت کو یکجا کرتا ہے۔ متعدد تکنیکی اشارے کے ہم آہنگی کے ذریعے ، اعلی کامیابی کی شرح کو برقرار رکھتے ہوئے خطرے کو مؤثر طریقے سے کنٹرول کرنے کے قابل ہے۔ اگرچہ کچھ پسماندگی موجود ہے ، لیکن معقول پیرامیٹرز کی اصلاح اور خطرے کے انتظام کے ذریعے ، مستحکم تجارتی اثر حاصل کیا جاسکتا ہے۔ یہ حکمت عملی خاص طور پر درمیانی اور طویل مدتی رجحانات کے لئے موزوں ہے ، اور مارکیٹ میں واضح سمت کے مواقع ظاہر ہونے پر بہتر کارکردگی کا مظاہرہ کرتی ہے۔
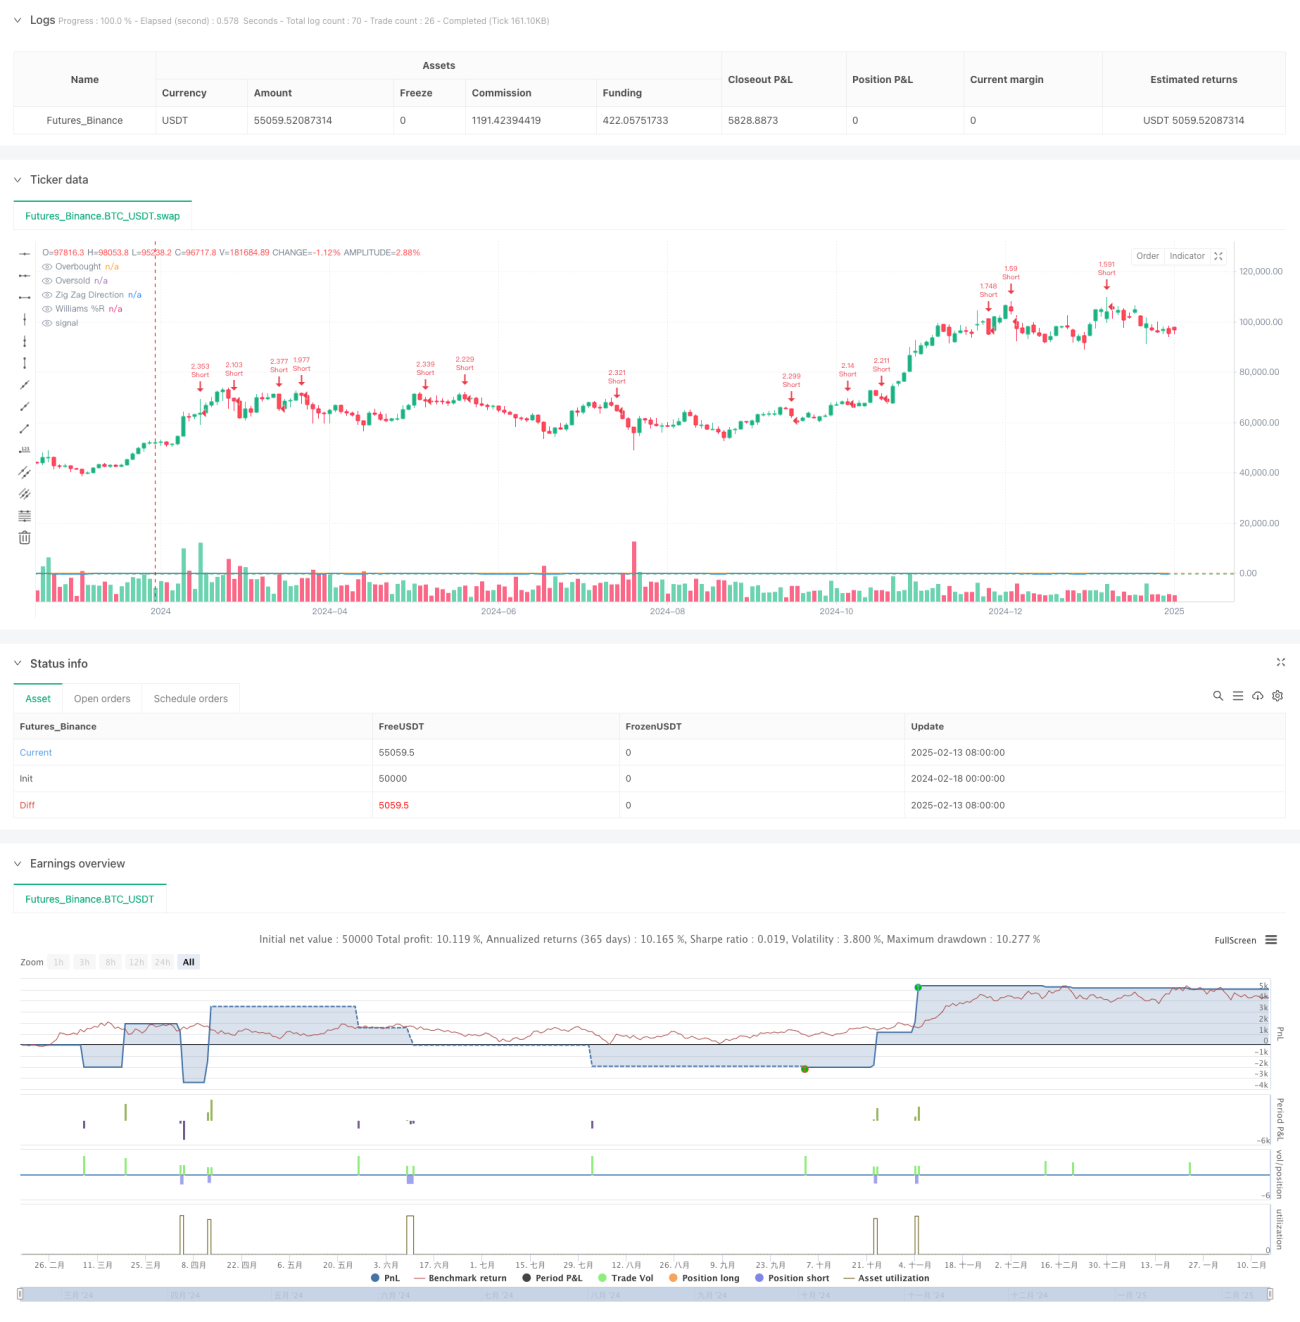
/*backtest
start: 2024-02-18 00:00:00
end: 2025-02-15 08:00:00
period: 2d
basePeriod: 2d
exchanges: [{"eid":"Futures_Binance","currency":"BTC_USDT"}]
*/

//@version=6
strategy("Zig Zag + Williams %R Strategy", overlay=true, default_qty_type=strategy.percent_of_equity, default_qty_value=300)

// ====================- 1