
جائزہ
یہ حکمت عملی ایک ٹریڈنگ سسٹم ہے جس میں گاسٹون کی لہر اور اسٹوچ آر ایس آئی اشارے پر مبنی رجحانات کی پیروی کی جاتی ہے۔ یہ حکمت عملی مارکیٹ کے رجحانات کی نشاندہی کرنے کے لئے گاسٹون چینل کا استعمال کرتی ہے اور اسٹوچ آر ایس آئی اشارے کے ساتھ مل کر اوورلوپ اوور سیل زون میں داخل ہونے کے وقت کو بہتر بناتی ہے۔ یہ نظام گاسٹون چینل کی تعمیر کرنے کے لئے ایک کثیر مقصود فٹ اپ طریقہ کار کا استعمال کرتا ہے ، جس میں قیمتوں کے رجحانات کی پیروی کی جاتی ہے جس میں اوپر اور نیچے کی رفتار کو متحرک طور پر ایڈجسٹ کیا جاتا ہے۔
حکمت عملی کا اصول
اس حکمت عملی کا بنیادی حصہ قیمتوں کا چینل ہے جو گوسٹن ویو کے الگورتھم پر مبنی ہے۔ اس میں مندرجہ ذیل اہم اقدامات شامل ہیں:
- کثیرالاضلاع فنکشن f_filt9x کا استعمال کرتے ہوئے 9 درجے کاگوسٹن فلٹرنگ کو لاگو کریں ، جس میں قطب کی اصلاح کے ذریعہ فلٹرنگ کو بہتر بنایا جائے
- HLC3 قیمتوں پر مبنی مین فلو لائن اور اتار چڑھاؤ کی شرح چینل کا حساب
- ریڈوسڈ لیگ موڈ کو متعارف کرایا گیا ہے جس میں فلٹرنگ کی تاخیر کو کم کیا گیا ہے اور فاسٹ ریسپونس موڈ میں ردعمل کی رفتار میں اضافہ کیا گیا ہے۔
- اسٹچ آر ایس آئی اشارے کا استعمال کرتے ہوئے اوورلوڈ اوورلوڈ رینج ((80/20) ٹریڈنگ سگنل کا تعین کریں
- گوسٹ چینل کے اوپر اور قیمتوں کے ٹریک کو توڑنے پر ، اسٹچ آر ایس آئی اشارے کے ساتھ مل کر ایک کثیر سگنل تیار کیا جاتا ہے
- جب قیمتوں میں کمی واقع ہوتی ہے تو اس سے باہر نکلیں
اسٹریٹجک فوائد
- گاسفین وے میں بہترین شور مٹانے کی صلاحیت ہے ، جو مارکیٹ کے شور کو مؤثر طریقے سے فلٹر کرتی ہے
- متعدد فارمولے کے ملاپ کے ذریعے رجحانات کی ہموار پیروی ، جعلی سگنل کو کم کرنا
- تاخیر کی اصلاح اور فوری ردعمل کے موڈ کی حمایت کرتا ہے ، جو مارکیٹ کی خصوصیات کے مطابق لچکدار ہے
- اسٹچ آر ایس آئی کے ساتھ مل کر انٹری ٹائمنگ کو بہتر بنانا ، تجارت کی کامیابی کی شرح میں اضافہ کرنا
- متحرک چینل کی چوڑائی کا استعمال کرتے ہوئے ، مارکیٹ میں اتار چڑھاؤ کی تبدیلیوں کے مطابق ڈھالنا
اسٹریٹجک رسک
- گاسپینوا نے کچھ تاخیر کی ہے جس کی وجہ سے وہ وقت پر داخل یا باہر نہیں ہوسکتے ہیں۔
- ہنگامہ خیز مارکیٹوں میں بار بار ٹریڈنگ سگنل پیدا ہوسکتے ہیں ، جس سے ٹریڈنگ کی لاگت میں اضافہ ہوتا ہے۔
- StochRSI اشارے بعض مارکیٹ کے حالات میں پیچھے رہ جانے کا اشارہ دے سکتا ہے
- پیرامیٹرز کو بہتر بنانے کا عمل پیچیدہ ہے اور مختلف مارکیٹ کے حالات میں پیرامیٹرز کو دوبارہ ایڈجسٹ کرنے کی ضرورت ہے
- سسٹم کمپیوٹنگ وسائل پر زیادہ مطالبہ کرتا ہے ، ریئل ٹائم کمپیوٹنگ میں کچھ تاخیر ہوتی ہے
حکمت عملی کی اصلاح کی سمت
- مارکیٹ کی حالت کے مطابق پیرامیٹرز کو متحرک طور پر ایڈجسٹ کرنے کے لئے ایک انکولی پیرامیٹرز کی اصلاح کا طریقہ کار متعارف کرایا گیا
- مارکیٹ کے مختلف حالات کے لئے مختلف پیرامیٹرز کے مجموعے کے ساتھ مارکیٹ کے ماحول کی شناخت کے ماڈیول کو شامل کرنا
- کوسٹرونگ کے الگورتھم کو بہتر بنانا ، حساب کتاب میں تاخیر کو مزید کم کرنا
- سگنل کی وشوسنییتا کو بہتر بنانے کے لئے زیادہ سے زیادہ تکنیکی اشارے متعارف کرانے کے لئے
- ذہین اسٹاپ نقصان کے طریقہ کار کی ترقی اور خطرے پر قابو پانے کی صلاحیت میں اضافہ
خلاصہ کریں۔
اس حکمت عملی نے گاسٹن کی لہر اور اسٹچ آر ایس آئی اشارے کے امتزاج کے ذریعہ مارکیٹ کے رجحانات کی موثر نگرانی کو ممکن بنایا ہے۔ نظام میں اچھی شور مچانے کی صلاحیت اور رجحانات کی شناخت کی صلاحیت ہے ، لیکن اس میں کچھ پسماندگی اور پیرامیٹرز کی اصلاح کی دشواری بھی ہے۔ مستقل اصلاح اور بہتری کے ذریعہ ، اس حکمت عملی کو حقیقی تجارت میں مستحکم منافع کی توقع ہے۔
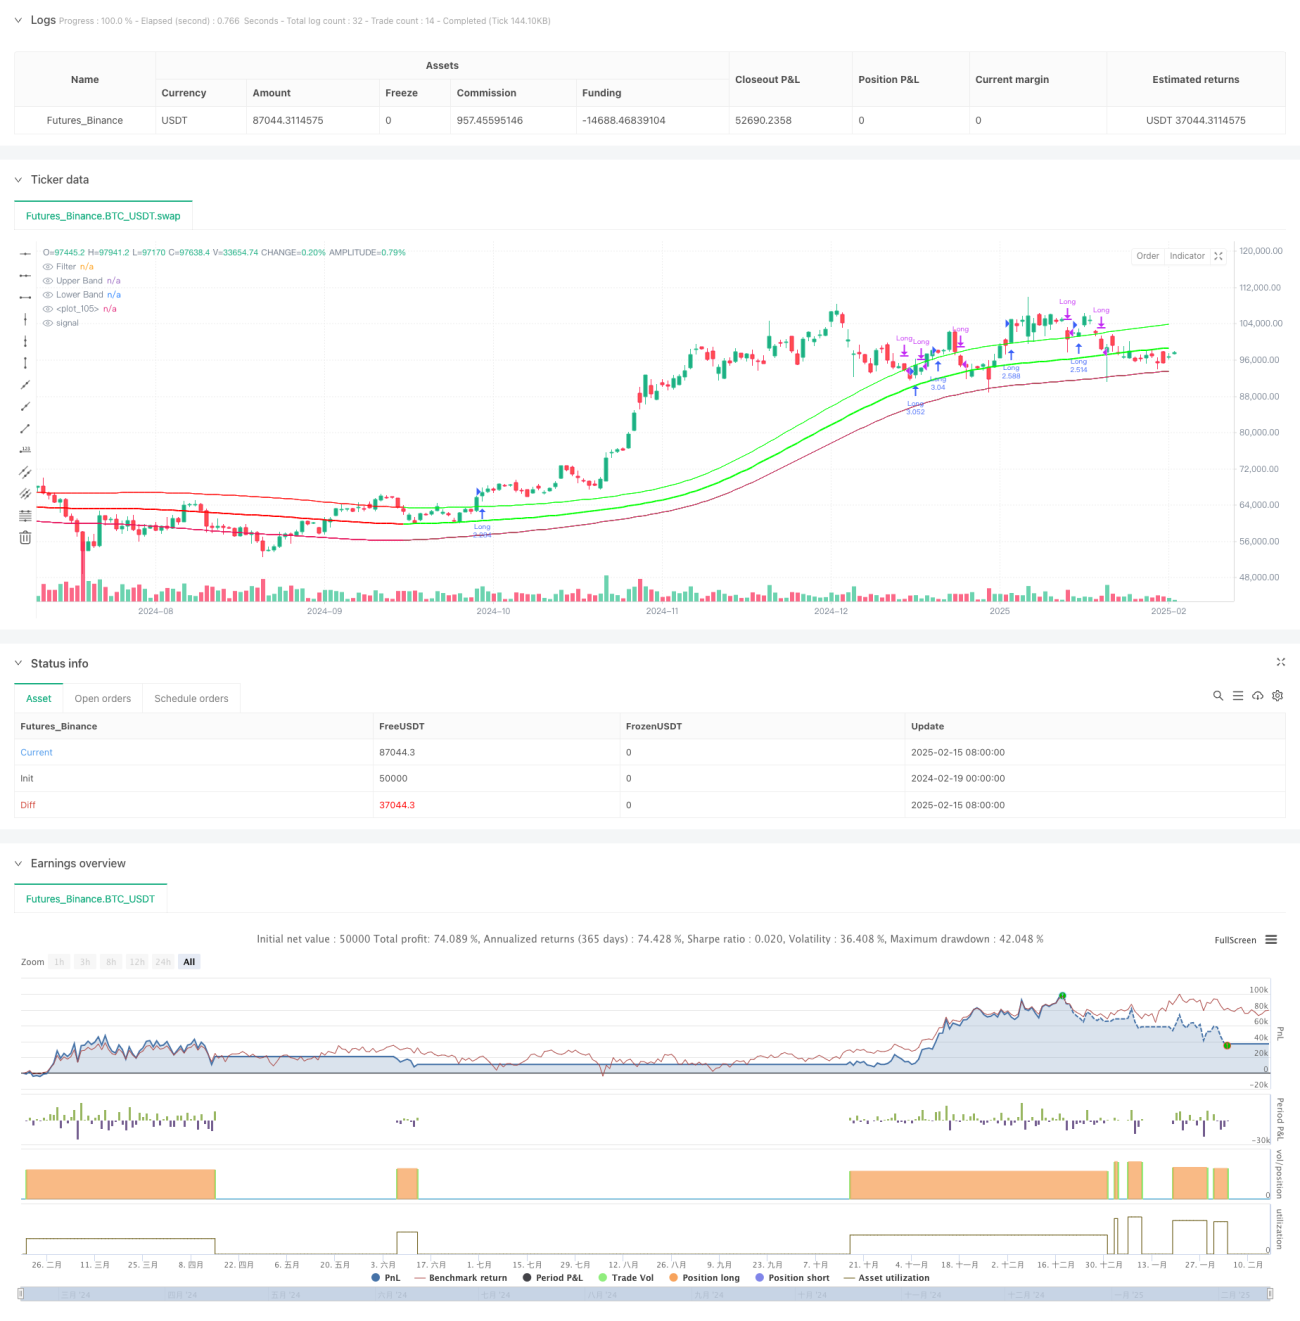
/*backtest
start: 2024-02-19 00:00:00
end: 2025-02-16 08:00:00
period: 1d
basePeriod: 1d
exchanges: [{"eid":"Futures_Binance","currency":"BTC_USDT"}]
*/

//@version=5
strategy(title="Demo GPT - Gaussian Channel Strategy v3.0", overlay=true, commission_type=strategy.commission.percent, commission_value=0.1, slippage=0, default_qty_type=strategy.percent_of_equity, default_qty_value=250)

// ============================================- 1