
جائزہ
یہ خالص طور پر قیمت کی کارروائی پر مبنی ایک بریک ٹریڈنگ حکمت عملی ہے ، جس میں 1: 5 کا اعلی خطرہ واپسی کا تناسب ڈیزائن کیا گیا ہے۔ حکمت عملی قیمت کی اہم سطحوں کی نشاندہی کرکے تجارت کرتی ہے ، اور مارکیٹ کی ساخت کی متحرک رکاوٹ اور منافع کے اہداف کے ساتھ مل کر ہے۔ حکمت عملی کسی تکنیکی اشارے پر انحصار نہیں کرتی ہے ، اور ٹریڈنگ کے فیصلے مکمل طور پر حقیقی وقت کی قیمت کی کارروائی پر مبنی ہوتے ہیں۔
حکمت عملی کا اصول
حکمت عملی کی بنیادی منطق میں درج ذیل اہم حصے شامل ہیں:
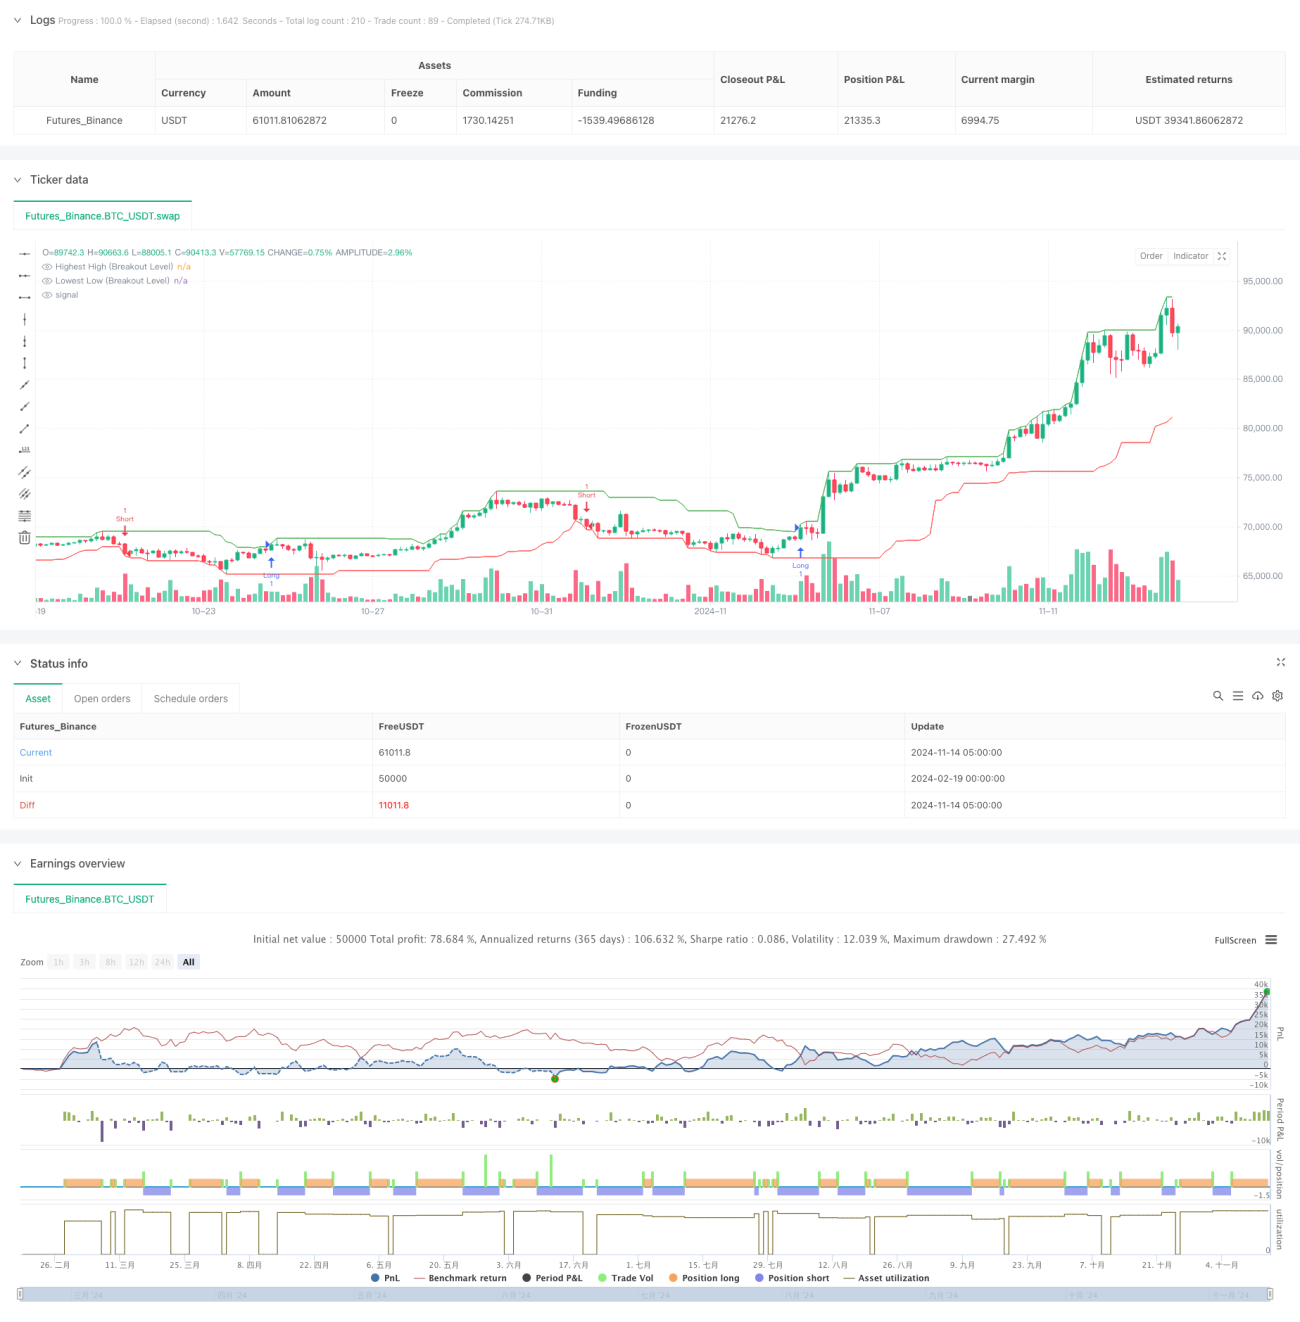
- قیمتوں کے سب سے زیادہ اور کم سے کم سطحوں کی شناخت کی طرف سے وقفے کے نقطہ نظر کی تشکیل
- جب بند ہونے والی قیمتوں نے سابقہ اونچائیوں کو توڑ دیا تو زیادہ پوزیشنیں کھولیں ، جب سابقہ نچلی سطح کو توڑ دیا تو خالی پوزیشنیں کھولیں
- متحرک اسٹاپ پوزیشن کی بنیاد پر حالیہ اتار چڑھاؤ کا تعین کریں ، کم پوزیشن پر کثیر پوزیشن کا تعین کریں اور زیادہ پوزیشن پر خالی پوزیشن کا تعین کریں
- منافع بخش ہدف کی پوزیشن کا حساب 1: 5 کے خطرے سے واپسی کے تناسب کے مطابق
- زیادہ سے زیادہ تجارت سے بچنے کے لئے روزانہ کی حد مقرر کریں
اس کے علاوہ ، یہ بھی کہا گیا ہے کہ اس کی قیمتوں کا تعین کرنے کے لئے کوئی تکنیکی اشارے استعمال نہیں کیے جاتے ہیں۔
اسٹریٹجک فوائد
- خالص قیمت کے رویے کی تجارت ، اشارے کی تاخیر سے ہونے والی رکاوٹوں سے بچنے کے لئے
- اعلی خطرہ واپسی کے تناسب کے ساتھ ڈیزائن کیا گیا ، ہر تجارت میں ممکنہ منافع خطرے سے پانچ گنا زیادہ ہے
- متحرک اسٹاپ نقصان کی ترتیب ، جو مارکیٹ کے ڈھانچے کے مطابق ڈھل جاتی ہے
- واضح ٹریڈنگ سگنل اور بصری مارکنگ، ٹریڈنگ پر عملدرآمد کی سہولت
- پیرامیٹرز مارکیٹ کے مختلف ماحول سے مطابقت رکھنے کے لیے انتہائی ایڈجسٹ ہوتے ہیں۔
- سخت رسک کنٹرول ، بشمول روزانہ تجارت کی تعداد کی حد
اسٹریٹجک رسک
- زلزلے کی مارکیٹوں میں اکثر جھوٹے بریک سگنل پیدا ہوسکتے ہیں
- اعلی خطرہ واپسی کی شرح جو نسبتا کم جیت کی شرح کا سبب بن سکتی ہے
- بریک آؤٹ کے بعد کال بیک روکنے کا سبب بن سکتا ہے
- مارکیٹ میں اتار چڑھاؤ کی تبدیلیاں حکمت عملی کی کارکردگی کو متاثر کرسکتی ہیں
- منافع کے ہدف تک پہنچنے کے لئے قیمتوں میں زیادہ تبدیلی کی ضرورت ہے
تخفیف کے اقدامات:
- رجحان مارکیٹ میں اس حکمت عملی کا استعمال
- اہم خبروں کے اعلانات کے دوران تجارت سے گریز کریں
- پوزیشن کا مناسب سائز
- باقاعدگی سے چیک کریں اور پیرامیٹرز کو بہتر بنائیں
حکمت عملی کی اصلاح کی سمت
- رجحان فلٹر شامل کریں ، صرف مرکزی رجحان کی سمت میں تجارت کریں
- ٹرانزیکشن کی تصدیق کے طریقہ کار کو شامل کرنا ، جس سے کامیابیوں کی وشوسنییتا میں اضافہ ہوتا ہے
- شرح اتار چڑھاو کے مطابق ایڈجسٹ رسک ریٹرن
- ٹرانزیکشن کی درستگی کو بہتر بنانے کے لئے کثیر ٹائم سائیکل تجزیہ متعارف کرایا گیا
- نقصانات کو روکنے کے لئے ذہین طریقہ کار تیار کریں ، جیسے نقصانات کا سراغ لگانا
- مارکیٹ کے ماحول کی شناخت کے لئے اضافی صلاحیتیں ، حکمت عملی کے پیرامیٹرز کو ایڈجسٹ کرنے کے لئے
خلاصہ کریں۔
یہ ایک سخت ڈیزائن ، منطقی اور واضح قیمت رویے کی تجارتی حکمت عملی ہے۔ اعلی رسک / منافع کے تناسب کے ذریعہ ڈیزائن کیا گیا ہے ، جو مؤثر طریقے سے خطرے پر قابو پانے کے ساتھ ساتھ کافی منافع حاصل کرنے کی کوشش کرتا ہے۔ حکمت عملی کا فائدہ خالص قیمت پر چلنے ، پیرامیٹرز کی لچکدار ایڈجسٹمنٹ ، اور خطرے پر قابو پانے میں ہے۔ اگرچہ کچھ غلط بریک آؤٹ کا خطرہ موجود ہے ، لیکن تجویز کردہ اصلاحی سمت سے حکمت عملی کی استحکام اور وشوسنییتا میں مزید اضافہ کیا جاسکتا ہے۔ یہ حکمت عملی واضح طور پر رجحانات والے مارکیٹ کے ماحول میں استعمال کے لئے موزوں ہے ، اور تاجروں کو تجارتی نظم و ضبط کی سختی سے پابندی کرنے کی ضرورت ہے۔
- 1