
جائزہ
یہ ایک کثیر ٹائم سائیکل ٹریڈنگ حکمت عملی ہے جو کہ چارٹ بینڈ تھیوری پر مبنی ہے۔ یہ حکمت عملی بنیادی طور پر اعلی ٹائم سائیکل کے چارٹ پیٹرن اور قیمت کے بینڈوں کا تجزیہ کرکے ممکنہ تجارتی مواقع کی نشاندہی کرتی ہے۔ یہ حکمت عملی ٹرانزیکشن فلٹرز اور متحرک اسٹاپ نقصان کے طریقہ کار کو مربوط کرتی ہے تاکہ پچھلے دور کے اعلی اور کم سے تجاوز کرکے رجحان سازی کے مواقع کو پکڑ سکے۔
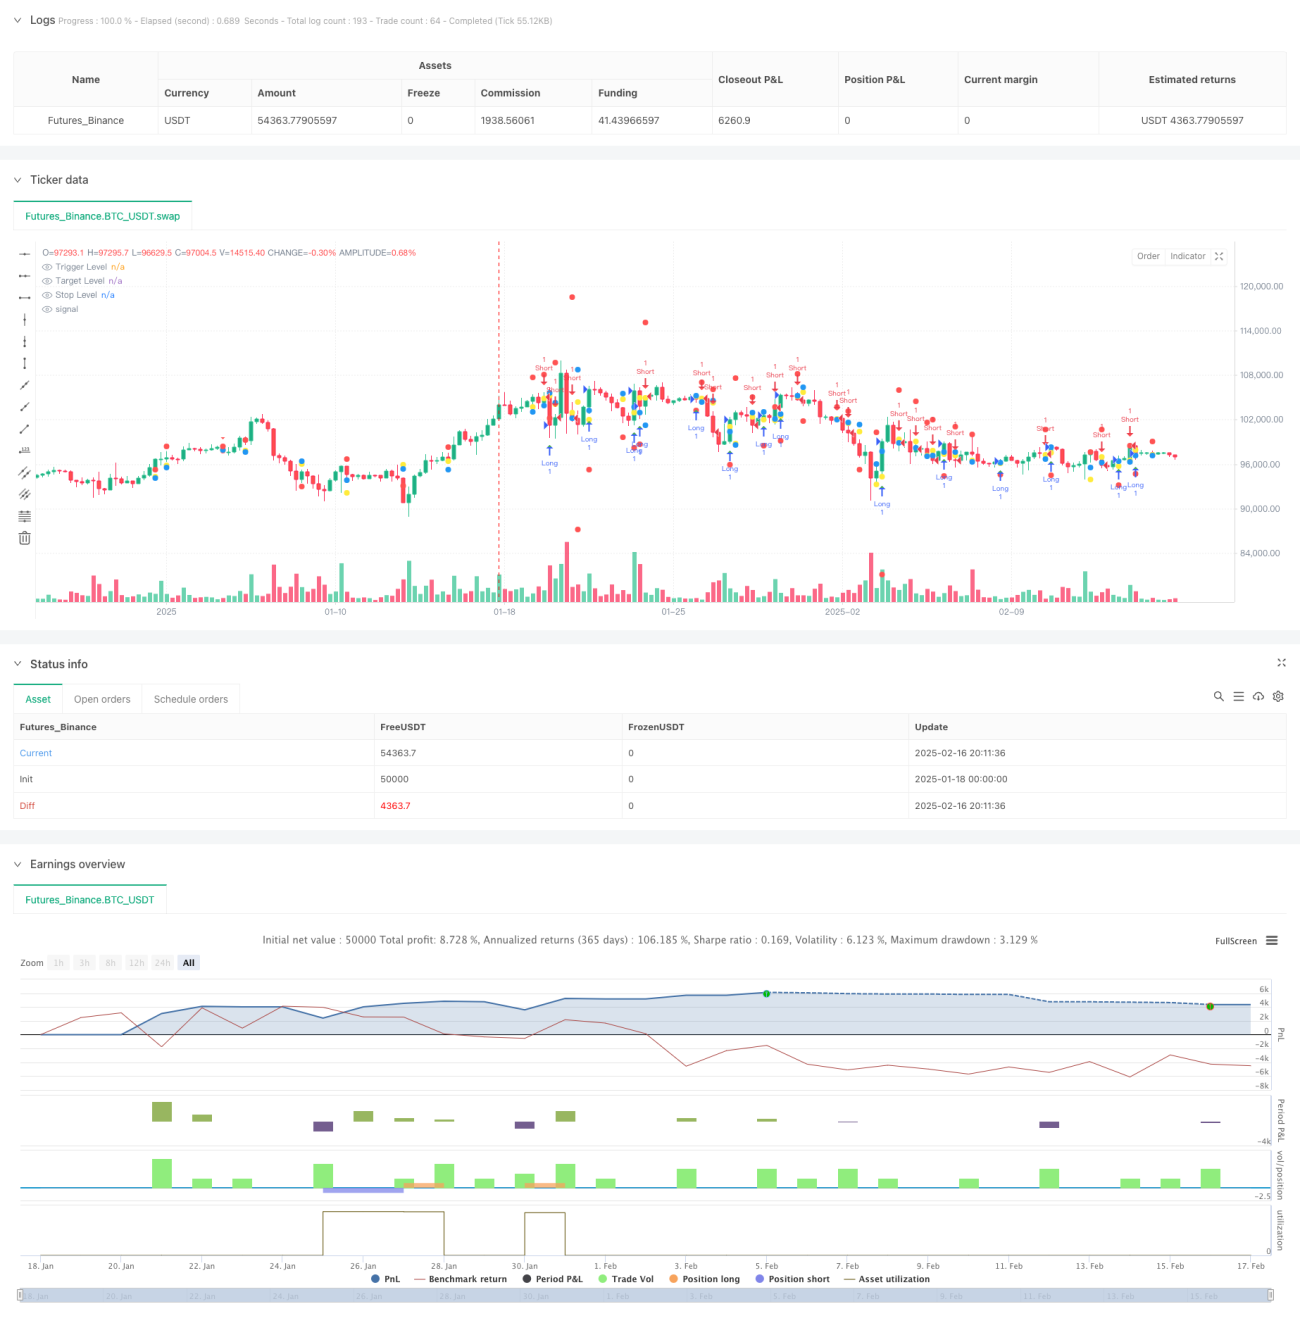
حکمت عملی کا اصول
اس حکمت عملی کا بنیادی مقصد اعلی وقت کی مدت (ڈیفالٹ 4 گھنٹے) کی نگرانی کرنا ہے جس میں قیمتوں میں پچھلے مرحلے کی حد سے تجاوز کرنا ہے۔ خاص طور پر:
- حکمت عملی کو مسلسل ٹریک اور ذخیرہ کرنے کے لئے دو اعلی وقت کی مدت K لائنوں کے اعلی اور کم اعداد و شمار
- جب موجودہ K لائن کی بندش کی قیمت پچھلی اونچائی سے کم ہو اور موجودہ K لائن کی جدت کی اونچائی ہو تو ، ایک کم کرنے کا اشارہ ہوتا ہے
- جب موجودہ K لائن کی بندش کی قیمت پچھلی کم سے زیادہ ہے اور موجودہ K لائن کی جدت کم ہے تو ، ایک کثیر سگنل تشکیل دیا جاتا ہے
- داخلہ کی قیمت K لائن کو متحرک کرنے کے لئے اعلی یا کم مقام پر مقرر کی گئی ہے
- منافع کا ہدف مقرر کریں جو پچھلے دور میں اسی طرح کے اعلی اور کم مقام پر ہے
- سٹاپ نقصان فاصلے کی حد کے سائز کی طرف سے متحرک طور پر ایڈجسٹ
اسٹریٹجک فوائد
- ملٹی ٹائم سائیکل تجزیہ زیادہ قابل اعتماد سگنل فراہم کرتا ہے
- متحرک اسٹاپ نقصان کی ترتیب ، جو مارکیٹ میں اتار چڑھاؤ کے مطابق ڈھل جاتی ہے
- ٹرانزیکشن کی تصدیق کو بڑھانے کے لئے اختیاری ٹرانزیکشن حجم فلٹرنگ میکانزم
- واضح بصری انٹرفیس ، بشمول ٹرگر کی قیمت ، ہدف کی قیمت اور اسٹاپ نقصان کی علامت
- حکمت عملی کی منطق سادہ اور واضح ہے، اسے سمجھنے اور اس پر عمل کرنے میں آسانی ہے۔
- مختلف ٹرانزیکشن اقسام اور مارکیٹ کے حالات کے لئے موزوں
اسٹریٹجک رسک
- زلزلے کے بازار میں بار بار جھوٹے بریک سگنل پیدا ہوسکتے ہیں
- زیادہ سے زیادہ سٹاپ نقصان ضرب سے زیادہ سے زیادہ ایک نقصان ہو سکتا ہے
- تاریخی قیمتوں کے اعداد و شمار پر انحصار کرنا ، تیزی سے بدلتے ہوئے مارکیٹ کے ماحول میں رد عمل کا شکار ہونا
- بنیادی عوامل کے اثرات کو نظر انداز کرنا
- کم لیکویڈیٹی والے بازاروں میں مؤثر طریقے سے عملدرآمد کرنا مشکل ہوسکتا ہے
حکمت عملی کی اصلاح کی سمت
- ٹرینڈ فلٹرز متعارف کروائیں ، جیسے چلتی اوسط یا ADX اشارے
- مارکیٹ کے حالات کے بارے میں مزید شرائط شامل کرنا
- اسٹاپ نقصان کی حکمت عملی کو بہتر بنانا ، متحرک اسٹاپ نقصان کو متعارف کرانے پر غور کریں
- ٹرانزیکشن حجم مینجمنٹ ماڈیول شامل کریں
- مزید ٹائم پیکیج کوآرڈینیشن تجزیہ شامل کرنے پر غور
- فریکوئنسی کے فیصلے کو بہتر بنانے کے لئے اتار چڑھاؤ کے اشارے متعارف کرانے
خلاصہ کریں۔
یہ ایک منظم ، منطقی اور واضح کثیر ٹائم سائیکل ٹریڈنگ حکمت عملی ہے۔ اعلی ٹائم سائیکلوں میں قیمتوں کے عمل کا تجزیہ کرکے ممکنہ رجحاناتی مواقع کی تلاش ، جبکہ خطرے کے انتظام اور فلٹرنگ کے طریقہ کار کو مربوط کرنا۔ حکمت عملی کا بنیادی فائدہ اس کی موافقت اور توسیع پذیری میں ہے ، جو مختلف مارکیٹ کے حالات کو آسان پیرامیٹرز کی ایڈجسٹمنٹ کے ساتھ اپنایا جاسکتا ہے۔ اگرچہ کچھ موروثی خطرات موجود ہیں ، لیکن تجویز کردہ اصلاح کی سمت سے حکمت عملی کی استحکام اور وشوسنییتا کو مزید بڑھایا جاسکتا ہے۔
- 1