جائزہ
یہ ایک تجارتی حکمت عملی ہے جس میں ایک سال کے دوران خرید و فروخت کے حجم کے ڈیلٹا ویلیو پر مبنی SMA ((سادہ منتقل اوسط) کے اعلی اور کم تجزیہ کی جاتی ہے۔ اس حکمت عملی میں خرید و فروخت کے حجم کے فرق کی اوسط اوسط کی حساب کتاب کی جاتی ہے اور اس کا موازنہ تاریخی اونچائی اور کم قیمت سے کیا جاتا ہے تاکہ ممکنہ تجارتی سگنل کی نشاندہی کی جاسکے۔ اس حکمت عملی میں طویل عرصے تک پیچھے ہٹنے کی مدت ہے ، جو درمیانی اور طویل مدتی رجحانات کی تجارت کے لئے موزوں ہے۔
حکمت عملی کا اصول
حکمت عملی کی بنیادی منطق درج ذیل کلیدی مراحل پر مبنی ہے:
- ڈیلٹا حساب: قیمت کی نقل و حرکت کا تجزیہ کرکے خرید و فروخت کی مقدار کا فرق حساب کریں۔ جب اختتامی قیمت کھلنے کی قیمت سے زیادہ ہو تو اسے خرید و فروخت کی مقدار کے طور پر ریکارڈ کیا جاتا ہے ، اس کے برعکس فروخت کی مقدار کے طور پر۔
- ایس ایم اے ہموار پروسیسنگ: شور کو کم کرنے کے لئے ڈیلٹا ویلیو پر 14 سائیکلوں کی چلتی اوسط پروسیسنگ۔
- ایک سال کے لئے اعلی اور کم سطحوں کا تعین: پچھلے سال میں ڈیلٹا ایس ایم اے کی اعلی اور کم قیمتوں کا حساب لگائیں۔
- سگنل ٹرگر حالات:
- خریدنے کا اشارہ: جب ڈیلٹا ایس ایم اے ایک سال کی نچلی سطح کے 70٪ سے نیچے 0 کے بعد ٹرگر ہوجاتا ہے
- بیچنے کا اشارہ: جب ڈیلٹا ایس ایم اے ایک سال کی اونچائی کے بعد 90٪ سے نیچے 60٪ سے نیچے جاتا ہے تو ٹرگر ہوتا ہے
اسٹریٹجک فوائد
- طویل مدتی رجحانات پر قابو پانے کی صلاحیت: ایک سال کے عرصے میں تاریخی اعداد و شمار کے تجزیہ کے ذریعے ، اہم رجحانات کو مؤثر طریقے سے پکڑنے کے قابل۔
- شور فلٹرنگ کا اثر اچھا ہے: ایس ایم اے ہموار پروسیسنگ اور کثیر تھرویل حالات کا استعمال کرتے ہوئے ، جعلی سگنل کو مؤثر طریقے سے کم کریں۔
- خطرہ کنٹرول معقول ہے: داخلہ اور باہر نکلنے کے واضح شرائط طے کیے گئے ہیں تاکہ ضرورت سے زیادہ تجارت سے بچا جاسکے۔
- لچکدار: حکمت عملی کے پیرامیٹرز کو مختلف مارکیٹ کے حالات کے مطابق ایڈجسٹ کیا جاسکتا ہے۔
اسٹریٹجک رسک
- تاخیر کا خطرہ: ایس ایم اے اور طویل المیعاد واپسی کے استعمال کی وجہ سے ، سگنل تاخیر کا سبب بن سکتا ہے۔
- جعلی بریک کا خطرہ: ہلچل مچانے والی مارکیٹوں میں غلط سگنل کا امکان۔
- مارکیٹ کے ماحول پر انحصار: غیر واضح رجحانات والے بازاروں میں خراب کارکردگی کا مظاہرہ کیا جاسکتا ہے۔
- پیرامیٹر حساسیت: حکمت عملی کی کارکردگی پر اثر انداز ہونے والی حد کی ترتیب
حکمت عملی کی اصلاح کی سمت
- متحرک کمی کی ایڈجسٹمنٹ: مارکیٹ کے اتار چڑھاؤ کی متحرک طور پر ایڈجسٹ کیا جا سکتا ہے.
- معاون اشارے میں اضافہ: دیگر تکنیکی اشارے کے ساتھ مل کر سگنل کی وشوسنییتا میں اضافہ۔
- اسٹاپ نقصان کا طریقہ کار متعارف کروائیں: خطرے کو کنٹرول کرنے کے لئے متحرک اسٹاپ نقصان کی ترتیب دیں
- مارکیٹ کے ماحول کو چھانٹنا: مارکیٹ کے ماحول کے فیصلے کی منطق شامل کریں ، مناسب ماحول میں حکمت عملی چلائیں۔
خلاصہ کریں۔
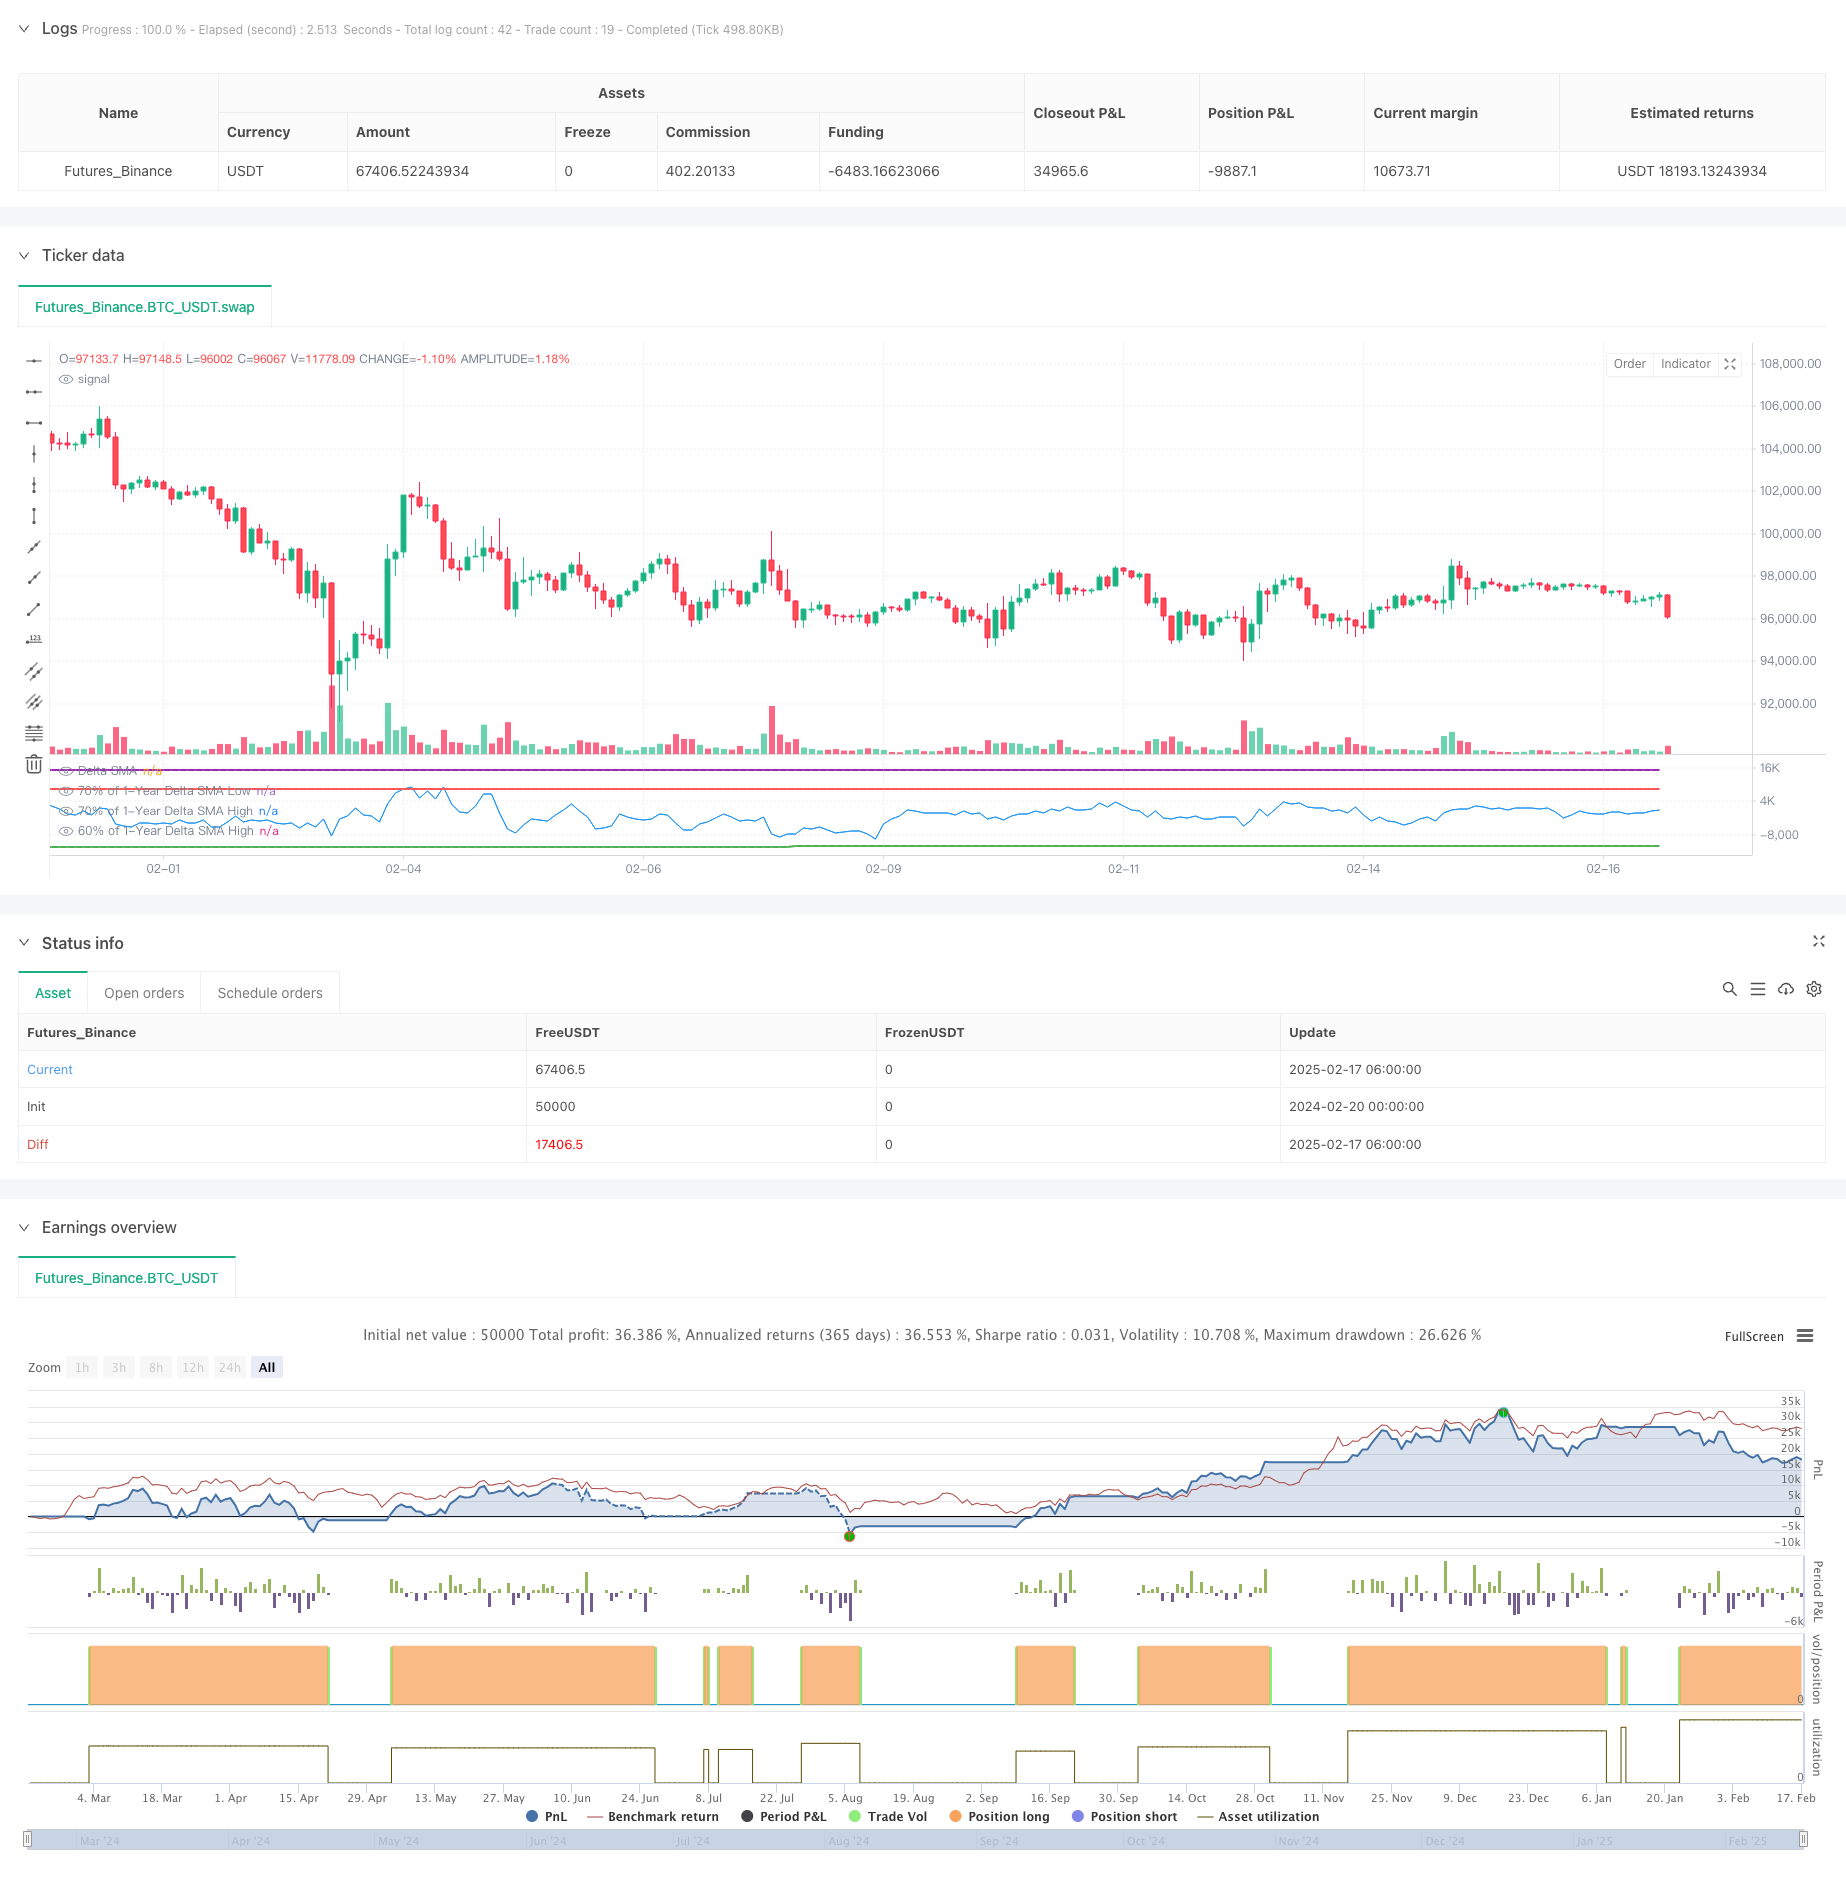
یہ ایک درمیانی اور طویل مدتی رجحانات کی پیروی کرنے والی حکمت عملی ہے جو حجم تجزیہ پر مبنی ہے ، مارکیٹ کے رجحانات کو خرید و فروخت کے حجم کے فرق کی تاریخی اونچائی اور نچلی سطح کا تجزیہ کرکے مارکیٹ کے رجحانات کو پکڑنے کے لئے۔ حکمت عملی کا ڈیزائن معقول ہے ، خطرہ کنٹرول میں ہے ، لیکن مارکیٹ کے ماحول میں موافقت اور پیرامیٹرز کی اصلاح کے مسائل پر توجہ دینے کی ضرورت ہے۔ تجویز کردہ اصلاحی سمت کے ذریعہ ، حکمت عملی میں مزید اضافے کی گنجائش ہے۔
/*backtest
start: 2024-02-20 00:00:00
end: 2025-02-17 08:00:00
period: 2h
basePeriod: 2h
exchanges: [{"eid":"Futures_Binance","currency":"BTC_USDT"}]
*/

//@version=5
strategy("Delta SMA 1-Year High/Low Strategy", overlay = false, margin_long = 100, margin_short = 100)

// Inputs
delta_sma_length = input.int(14, title="Delta SMA Length", minval=1)  // SMA length for Delta
lookback_days = 365  // Lookback period fixed to 1 year

// Function to calculate buy and sell volume
buy_volume = close > open ? volume : na
sell_volume = close < open ? volume : na

// Calculate the Delta
delta = nz(buy_volume, 0) - nz(sell_volume, 0)

// Calculate Delta SMA
delta_sma = ta.sma(delta, delta_sma_length)

// Lookback period in bars (1 bar = 1 day)
desired_lookback_bars = lookback_days

// Ensure lookback doesn't exceed available historical data
max_lookback_bars = math.min(desired_lookback_bars, 365)  // Cap at 365 bars (1 year)

// Calculate Delta SMA low and high within the valid lookback period
delta_sma_low_1yr = ta.lowest(delta_sma, max_lookback_bars)
delta_sma_high_1yr = ta.highest(delta_sma, max_lookback_bars)

// Define thresholds for buy and sell conditions
very_low_threshold = delta_sma_low_1yr * 0.7
above_70_threshold = delta_sma_high_1yr * 0.9
below_60_threshold = delta_sma_high_1yr * 0.5

// Track if `delta_sma` was very low and persist the state
var bool was_very_low = false
if delta_sma < very_low_threshold
    was_very_low := true
if ta.crossover(delta_sma, 10000)
    was_very_low := false  // Reset after crossing 0

// Track if `delta_sma` crossed above 70% of the high
var bool crossed_above_70 = false
if ta.crossover(delta_sma, above_70_threshold)
    crossed_above_70 := true
if delta_sma < below_60_threshold*0.5 and crossed_above_70
    crossed_above_70 := false  // Reset after triggering sell

// Buy condition: `delta_sma` was very low and now crosses 0
buy_condition = was_very_low and ta.crossover(delta_sma, 0)

// Sell condition: `delta_sma` crossed above 70% of the high and now drops below 60%
sell_condition = crossed_above_70 and delta_sma < below_60_threshold

// Place a long order when buy condition is met
if buy_condition
    strategy.entry("Buy", strategy.long)

// Place a short order when sell condition is met
if sell_condition
    strategy.close("Buy")

// Plot Delta SMA and thresholds for visualization
plot(delta_sma, color=color.blue, title="Delta SMA")
plot(very_low_threshold, color=color.green, title="70% of 1-Year Delta SMA Low", linewidth=2)
plot(above_70_threshold, color=color.purple, title="70% of 1-Year Delta SMA High", linewidth=2)
plot(below_60_threshold, color=color.red, title="60% of 1-Year Delta SMA High", linewidth=2)

// Optional: Plot Buy and Sell signals on the chart
//plotshape(series=buy_condition, title="Buy Signal", location=location.belowbar, color=color.new(color.green, 0), style=shape.labelup, text="BUY")
//plotshape(series=sell_condition, title="Sell Signal", location=location.abovebar, color=color.new(color.red, 0), style=shape.labeldown, text="SELL")