
یہ حکمت عملی ایک جامع تجارتی نظام ہے جس میں فیبونیکی واپسی کی سطح ، حرکت پذیر اوسط اور متحرک رجحان کا فیصلہ شامل ہے۔ یہ تیزی سے چلنے والی اوسط اور آہستہ چلنے والی اوسط کی کراسنگ کے ذریعہ تجارتی سگنل تیار کرتا ہے ، جبکہ فیبونیکی واپسی کی سطح کو قیمت کے اہم حوالہ کے طور پر استعمال کرتا ہے ، اور اس میں ٹریڈنگ کے وقت کو بہتر بنانے کے لئے رجحان کا فیصلہ شامل ہے۔ یہ نظام خطرے کے انتظام کے ل percent فیصد اسٹاپ اور اسٹاپ سیٹنگ کو بھی مربوط کرتا ہے۔
حکمت عملی کی بنیادی منطق درج ذیل کلیدی عناصر پر مبنی ہے:
یہ ایک جامع تجارتی حکمت عملی ہے جو متعدد کلاسیکی تکنیکی تجزیہ ٹولز کو جوڑتی ہے۔ متحرک اوسط ، فبونیکی ریٹرن اور رجحانات کے تجزیے کے ساتھ مل کر ، حکمت عملی مارکیٹ میں ممکنہ تجارتی مواقع کو پکڑنے کے قابل ہے۔ اس کے ساتھ ہی ، ایک بہتر رسک مینجمنٹ سسٹم اور واضح بصری انٹرفیس اس کو بہتر عملی بناتا ہے۔ اگرچہ کچھ موروثی خطرات موجود ہیں ، لیکن مستقل اصلاح اور بہتری کے ذریعہ ، اس حکمت عملی کو حقیقی تجارت میں بہتر کارکردگی کا مظاہرہ کرنے کی امید ہے۔
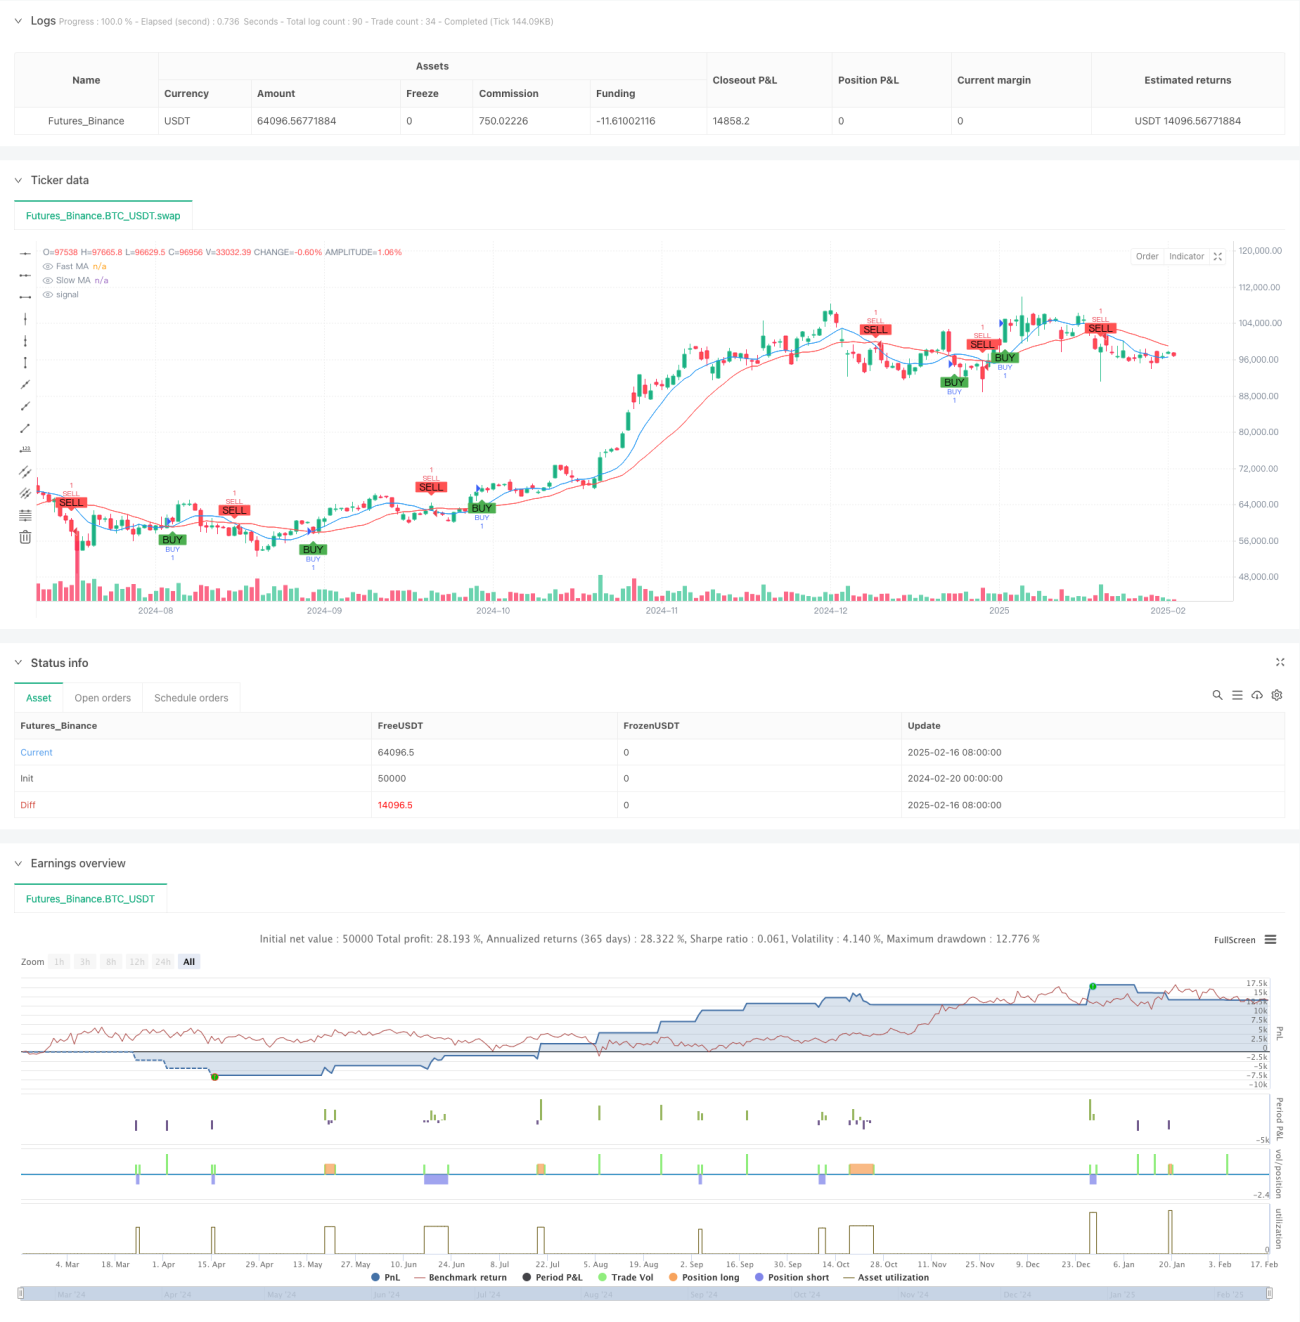
/*backtest
start: 2024-02-20 00:00:00
end: 2025-02-17 08:00:00
period: 1d
basePeriod: 1d
exchanges: [{"eid":"Futures_Binance","currency":"BTC_USDT"}]
*/
//@version=5
strategy("Buy/Sell Strategy with TP, SL, Fibonacci Levels, and Trend", overlay=true)
// Input for stop loss and take profit percentages
stopLossPercentage = input.int(2, title="Stop Loss (%)") // Stop loss percentage
takeProfitPercentage = input.int(4, title="Take Profit (%)") // Take profit percentage
// Example of a moving average crossover strategy
fastLength = input.int(9, title="Fast MA Length")
slowLength = input.int(21, title="Slow MA Length")
fastMA = ta.sma(close, fastLength)
slowMA = ta.sma(close, slowLength)
// Entry conditions (Buy when fast MA crosses above slow MA, Sell when fast MA crosses below slow MA)
longCondition = ta.crossover(fastMA, slowMA)
shortCondition = ta.crossunder(fastMA, slowMA)
// Plot moving averages for visual reference
plot(fastMA, color=color.blue, title="Fast MA")
plot(slowMA, color=color.red, title="Slow MA")
// Fibonacci Retracement Levels
lookback = input.int(100, title="Lookback Period for Fibonacci Levels")
highLevel = ta.highest(high, lookback)
lowLevel = ta.lowest(low, lookback)
fib236 = lowLevel + (highLevel - lowLevel) * 0.236
fib382 = lowLevel + (highLevel - lowLevel) * 0.382
fib50 = lowLevel + (highLevel - lowLevel) * 0.5
fib618 = lowLevel + (highLevel - lowLevel) * 0.618
// Display Fibonacci levels as text on the chart near price panel (left of candle)
label.new(bar_index, fib236, text="Fib 23.6%: " + str.tostring(fib236, "#.##"), style=label.style_label_left, color=color.purple, textcolor=color.white, size=size.small, xloc=xloc.bar_index, yloc=yloc.price)
label.new(bar_index, fib382, text="Fib 38.2%: " + str.tostring(fib382, "#.##"), style=label.style_label_left, color=color.blue, textcolor=color.white, size=size.small, xloc=xloc.bar_index, yloc=yloc.price)
label.new(bar_index, fib50, text="Fib 50%: " + str.tostring(fib50, "#.##"), style=label.style_label_left, color=color.green, textcolor=color.white, size=size.small, xloc=xloc.bar_index, yloc=yloc.price)
label.new(bar_index, fib618, text="Fib 61.8%: " + str.tostring(fib618, "#.##"), style=label.style_label_left, color=color.red, textcolor=color.white, size=size.small, xloc=xloc.bar_index, yloc=yloc.price)
// Trend condition: Price uptrend or downtrend
trendCondition = close > fastMA ? "Uptrending" : close < fastMA ? "Downtrending" : "Neutral"
// Remove previous trend label and add new trend label
var label trendLabel = na
if (not na(trendLabel))
label.delete(trendLabel)
// Create a new trend label based on the current trend
trendLabel := label.new(bar_index, close, text="Trend: " + trendCondition, style=label.style_label_left, color=color.blue, textcolor=color.white, size=size.small, xloc=xloc.bar_index, yloc=yloc.price)
// Buy and Sell orders with Stop Loss and Take Profit
if (longCondition)
// Set the Stop Loss and Take Profit levels based on entry price
stopLossLevel = close * (1 - stopLossPercentage / 100)
takeProfitLevel = close * (1 + takeProfitPercentage / 100)
// Enter long position with stop loss and take profit levels
strategy.entry("BUY", strategy.long)
strategy.exit("Sell", "BUY", stop=stopLossLevel, limit=takeProfitLevel)
// Display TP, SL, and Entry price labels on the chart near price panel (left of candle)
label.new(bar_index, takeProfitLevel, text="TP\n" + str.tostring(takeProfitLevel, "#.##"), style=label.style_label_left, color=color.green, textcolor=color.white, size=size.small, xloc=xloc.bar_index, yloc=yloc.price)
label.new(bar_index, stopLossLevel, text="SL\n" + str.tostring(stopLossLevel, "#.##"), style=label.style_label_left, color=color.red, textcolor=color.white, size=size.small, xloc=xloc.bar_index, yloc=yloc.price)
label.new(bar_index, close, text="BUY\n" + str.tostring(close, "#.##"), style=label.style_label_left, color=color.blue, textcolor=color.white, size=size.small, xloc=xloc.bar_index, yloc=yloc.price)
if (shortCondition)
// Set the Stop Loss and Take Profit levels based on entry price
stopLossLevel = close * (1 + stopLossPercentage / 100)
takeProfitLevel = close * (1 - takeProfitPercentage / 100)
// Enter short position with stop loss and take profit levels
strategy.entry("SELL", strategy.short)
strategy.exit("Cover", "SELL", stop=stopLossLevel, limit=takeProfitLevel)
// Display TP, SL, and Entry price labels on the chart near price panel (left of candle)
label.new(bar_index, takeProfitLevel, text="TP\n" + str.tostring(takeProfitLevel, "#.##"), style=label.style_label_left, color=color.green, textcolor=color.white, size=size.small, xloc=xloc.bar_index, yloc=yloc.price)
label.new(bar_index, stopLossLevel, text="SL\n" + str.tostring(stopLossLevel, "#.##"), style=label.style_label_left, color=color.red, textcolor=color.white, size=size.small, xloc=xloc.bar_index, yloc=yloc.price)
label.new(bar_index, close, text="SELL\n" + str.tostring(close, "#.##"), style=label.style_label_left, color=color.orange, textcolor=color.white, size=size.small, xloc=xloc.bar_index, yloc=yloc.price)
// Plot Buy/Sell labels on chart
plotshape(series=longCondition, title="BUY Signal", location=location.belowbar, color=color.green, style=shape.labelup, text="BUY")
plotshape(series=shortCondition, title="SELL Signal", location=location.abovebar, color=color.red, style=shape.labeldown, text="SELL")