
جائزہ
یہ حکمت عملی ایک ٹریڈنگ سسٹم ہے جس میں رجحانات کی پیروی کی جاتی ہے جس کی بنیاد پر برن بینڈ توڑنے اور اسکرین لائن کی شکل ہوتی ہے۔ حکمت عملی تجارت کے اشارے کی نشاندہی کرتی ہے جس میں تین مسلسل برن بینڈ توڑنے والے اسکرین لائنز کی نشاندہی کی جاتی ہے ، اور اسکرین لائن اداروں میں اختتامی قیمت کے ساتھ مل کر اسکرین لائن کی پوزیشن ہوتی ہے۔ اس نظام میں ہر تجارت کے لئے ایک مقررہ 1: 1 رسک منافع کا تناسب استعمال کیا جاتا ہے تاکہ ہر تجارت کو روکنے اور روکنے کا انتظام کیا جاسکے۔
حکمت عملی کا اصول
حکمت عملی کی بنیادی منطق درج ذیل کلیدی عناصر پر مبنی ہے:
- 20 سائیکلوں کے ساتھ برن بینڈ کو بنیادی اشارے کے طور پر استعمال کیا جاتا ہے، معیاری فاصلے کا ضرب 2.0 ہے
- کثیر سر داخلہ کی شرائط: تین مسلسل K لائنوں کی بندش کی قیمت ٹریک سے ٹکرا گئی ، اور یہ تینوں K لائنیں یانگ لائن ہیں ، اور بندش کی قیمتیں ادارے کے اوپری نصف حصے میں ہیں
- خالی سر داخلہ کی شرائط: تین مسلسل K لائنوں کی بندش کی قیمت ٹریک سے ٹکرا گئی ، اور یہ تینوں K لائنیں منفی لائنیں ہیں ، اور بندش کی قیمتیں ادارے کے نچلے نصف حصے میں ہیں
- سٹاپ نقصان کی پہلی سگنل K لائن کے زیادہ سے زیادہ قیمت پر مقرر کیا جاتا ہے
- سٹاپ پوزیشن قائم کرنے پر 1:1 پر مبنی رسک ریٹرن
اسٹریٹجک فوائد
- ایک سے زیادہ تصدیق کے طریقہ کار کو اپنانے کے لئے، تین مسلسل K لائن ٹرانسمیشن کی شکل کی ضروریات کو مؤثر طریقے سے جعلی ٹرانسمیشن کے خطرے کو کم کرنا
- اختتامی قیمتوں کے K لائن اداروں میں پوزیشننگ کے ساتھ مل کر ، رجحانات کی تصدیق کی وشوسنییتا میں اضافہ ہوا
- فکسڈ رسک ٹو انکم ریٹ کا استعمال کرتے ہوئے پوزیشن مینجمنٹ ، خطرے کو کنٹرول کرنے میں آسان ہے
- حکمت عملی کی منطق واضح، سمجھنے اور لاگو کرنے میں آسان ہے۔
- ٹریڈنگ سگنلز کو نشان زد کرنے کے ذریعہ بصری طور پر دکھائیں ، تاکہ تجزیہ کی سہولت فراہم کی جاسکے
اسٹریٹجک رسک
- متواتر غلط سگنل غیر مستحکم بازاروں میں ہو سکتے ہیں۔
- فکسڈ رسک بائیو تناسب مضبوط رجحانات پر مکمل طور پر قابو نہیں پا سکتا
- مسلسل تین K لائنوں کے سخت تقاضوں سے کچھ ممکنہ مواقع ضائع ہوسکتے ہیں
- سٹاپ نقصان کی ترتیب سگنل K لائن کے انتہائی قیمت پر ہے، زیادہ اتار چڑھاؤ کے ساتھ سٹاپ نقصان کی پوزیشن بہت دور ہوسکتی ہے
خطرے کو مندرجہ ذیل طریقوں سے سنبھالنے کی سفارش کی جاتی ہے:
- مارکیٹ کے اتار چڑھاؤ کے ساتھ مل کر برن بینڈ پیرامیٹرز کو ایڈجسٹ کرنا
- مارکیٹ کی خصوصیت کے مطابق ایڈجسٹ رسک ٹو ریٹ
- رجحان کی تصدیق کے اشارے شامل کریں۔
- سٹاپ نقصان کی پوزیشن کی ترتیب کو بہتر بنانے کا طریقہ
حکمت عملی کی اصلاح کی سمت
- پیرامیٹرز کو بہتر بنائیں:
- مختلف مارکیٹ کی خصوصیات کے مطابق متحرک طور پر بلین بینڈ کے دورانیے اور معیاری فرق کے ضرب کو ایڈجسٹ کیا جاسکتا ہے
- تین K لائنوں کی ضرورت کو متحرک فیصلے میں تبدیل کرنے پر غور کریں
- سگنل کی اصلاح:
- ADX یا رجحان لائن جیسے رجحان کی تصدیق کے اشارے میں اضافہ کریں
- ٹرانسمیشن کی تصدیق کا طریقہ کار متعارف کرایا
- سوئنگ انڈیکیٹر کو بطور معاون شامل کرنے پر غور کریں
- پوزیشن مینجمنٹ کی اصلاح:
- متحرک رسک-فائدہ تناسب کی ترتیب
- فنڈ مینجمنٹ ماڈیول شامل کریں
- ذخیرہ اندوزی اور امن ذخیرہ اندوزی کے طریقہ کار پر غور
- سٹاپ نقصان کی اصلاح:
- ٹریکنگ سٹاپ نقصان کا نظام متعارف کروانا
- ATR پر مبنی اسٹاپ نقصان فاصلہ
- وقت کے ضیاع پر غور کریں
خلاصہ کریں۔
یہ ایک ساختہ ، منطقی اور واضح رجحان کی پیروی کرنے والی حکمت عملی ہے۔ بورن کی پٹی کے بریک اور فکسڈ لائن فارمیٹ کے متعدد تصدیق کے طریقہ کار کے ذریعہ ، جعلی سگنل کے خطرے کو مؤثر طریقے سے کم کیا گیا ہے۔ مقررہ رسک کمائی کا تناسب سیٹنگ تجارت کے انتظام کو آسان بناتی ہے ، لیکن حکمت عملی کی لچک کو بھی محدود کرتی ہے۔ پیرامیٹرز کی ترتیب کو بہتر بنانے ، تصدیق کے اشارے کو بڑھانے ، پوزیشن مینجمنٹ کو بہتر بنانے وغیرہ کے ذریعہ حکمت عملی میں بہتری کی گنجائش ہے۔ مجموعی طور پر ، یہ عملی طور پر قابل قدر بنیادی حکمت عملی کا فریم ورک ہے ، جس کو مخصوص ضروریات کے مطابق مزید بہتر بنایا جاسکتا ہے۔
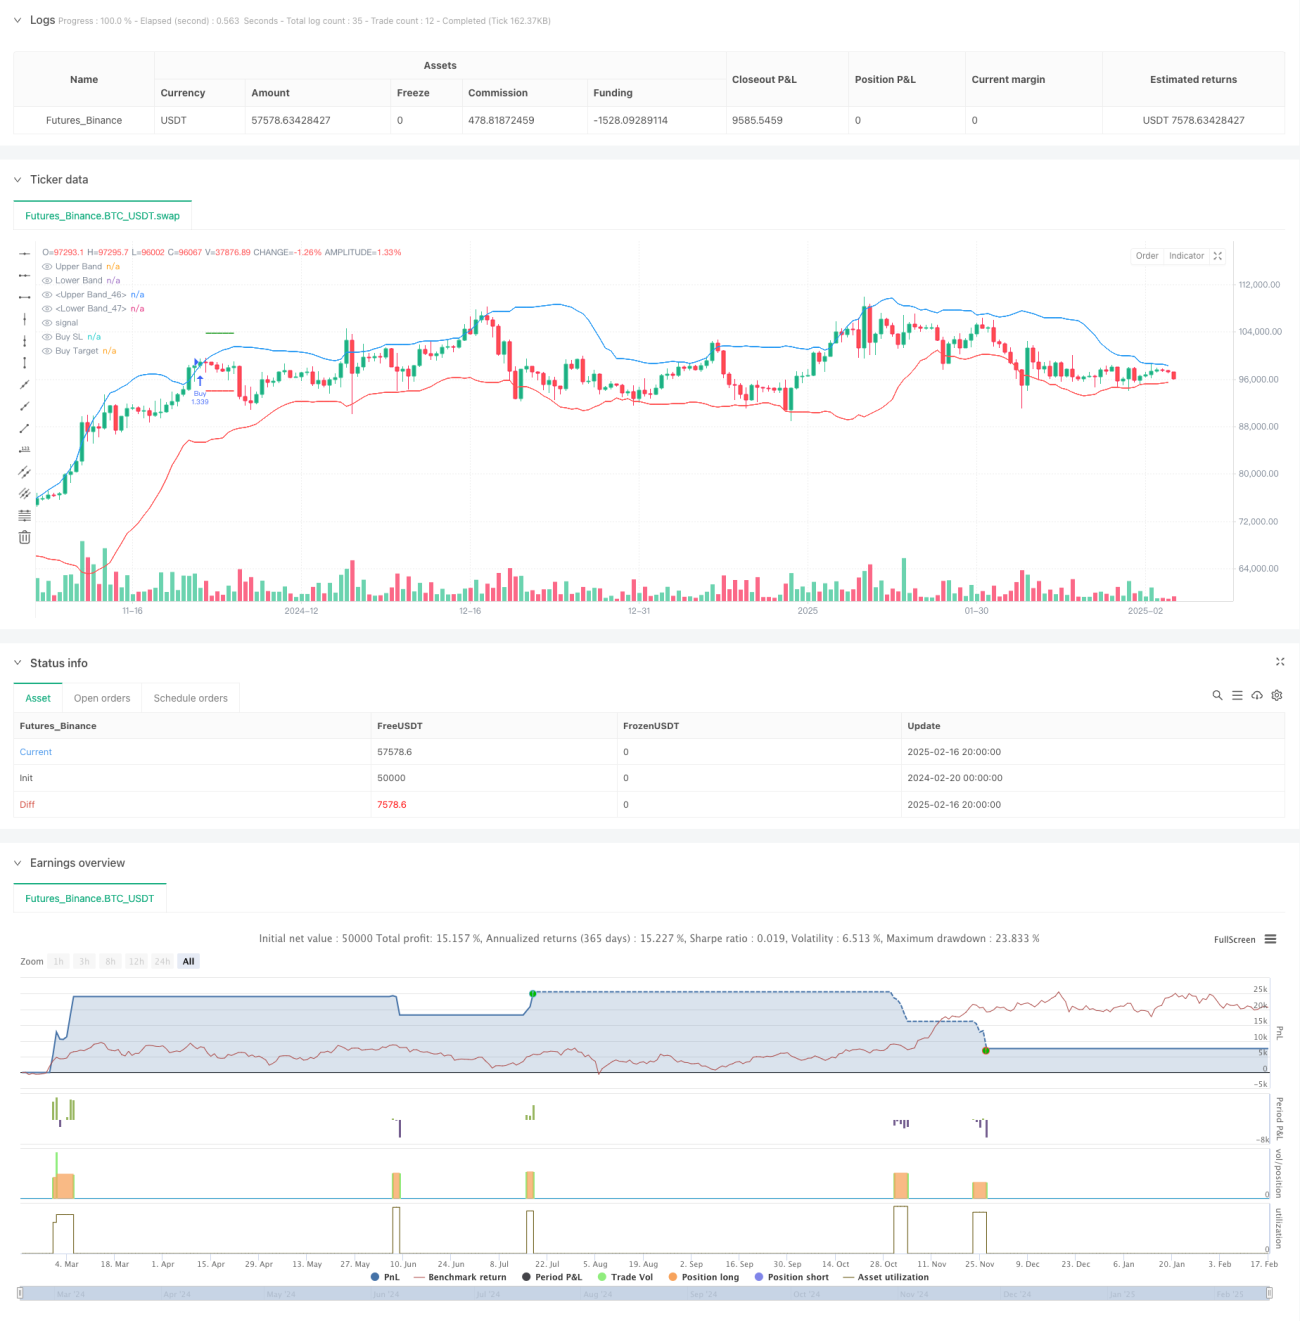
/*backtest
start: 2024-02-20 00:00:00
end: 2025-02-17 08:00:00
period: 12h
basePeriod: 12h
exchanges: [{"eid":"Futures_Binance","currency":"BTC_USDT"}]
*/

//@version=6
strategy("Bollinger Band Strategy (Close Near High/Low Relative to Half Range)", overlay=true, default_qty_type=strategy.percent_of_equity, default_qty_value=200, pyramiding=0)

// Bollinger Bands- 1