
جائزہ
یہ ایک ہائی فریکوئینسی ٹریڈنگ حکمت عملی کا نظام ہے جو بولنگر بینڈ ، متحرک اوسط فرق (ایم اے سی ڈی) اور حجم تجزیہ کو جوڑتا ہے۔ یہ حکمت عملی مارکیٹ میں الٹ جانے کے مواقع کو پکڑنے کے لئے بولنگر بینڈ میں قیمتوں کے ٹریک ڈاؤن کے خلاف توڑ اور واپسی کی نشاندہی کرتی ہے ، جس میں ایم اے سی ڈی کی حرکت پذیری اشارے اور حجم کی تصدیق کے ساتھ مل کر کام کیا جاتا ہے۔ نظام میں روزانہ تجارت کی زیادہ سے زیادہ تعداد کی حد مقرر کی گئی ہے اور اس میں ایک مکمل رسک مینجمنٹ میکانزم موجود ہے۔
حکمت عملی کا اصول
یہ حکمت عملی بنیادی طور پر تین بنیادی اشارے پر مبنی ہے:
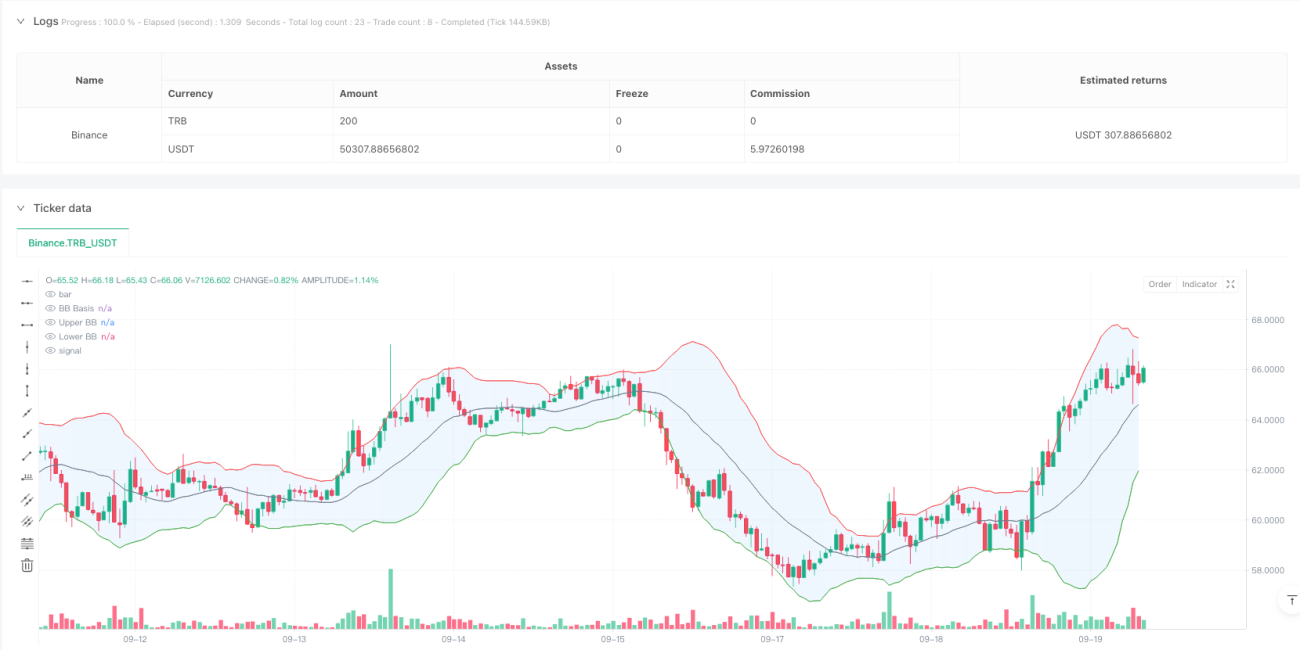
- برن بینڈ اشارے: 20 ادوار کی سادہ حرکت پذیری اوسط ((SMA) کو وسط ریل کے طور پر استعمال کرتے ہوئے ، معیاری فاصلے کی ضرب 2.0 کے حساب سے اوپر اور نیچے ریل۔ جب قیمت برن بینڈ کو توڑنے کے بعد واپس آتی ہے تو ، نظام ممکنہ تجارتی سگنل جاری کرتا ہے۔
- MACD اشارے: معیاری پیرامیٹرز کی ترتیب ((12 ، 26 ، 9) کا استعمال کرتے ہوئے ، قیمتوں کے رجحان کی حرکیات کی تصدیق کریں۔ جب MACD لائن سگنل لائن کے اوپر ہوتی ہے تو زیادہ سگنل کی تصدیق کی جاتی ہے ، جب سگنل لائن کے نیچے ہوتی ہے تو کم سگنل کی تصدیق ہوتی ہے۔
- لین دین کا تجزیہ: لین دین کی تصدیق کے لئے 20 دورانیہ کی حرکت پذیری اوسط کا استعمال کریں ، اور مارکیٹ میں شرکت کو یقینی بنانے کے لئے سگنل کے ظہور پر لین دین کی کم از کم اوسط مقدار کی ضرورت ہے۔
اسٹریٹجک فوائد
- ایک سے زیادہ سگنل کی تصدیق: ٹریڈنگ سگنل کی وشوسنییتا میں نمایاں اضافہ برن بینڈ ، MACD اور حجم کی تین بار تصدیق کے ذریعہ ہوا۔
- بصری ڈیزائن: یہ نظام بروکرز کو فوری طور پر ٹریڈنگ کے مواقع کی شناخت میں مدد کرنے کے لئے برین بینڈ بھرنے ، سگنل مارکنگ اور پس منظر کے رنگ میں تبدیلی سمیت گرافک اشارے فراہم کرتا ہے۔
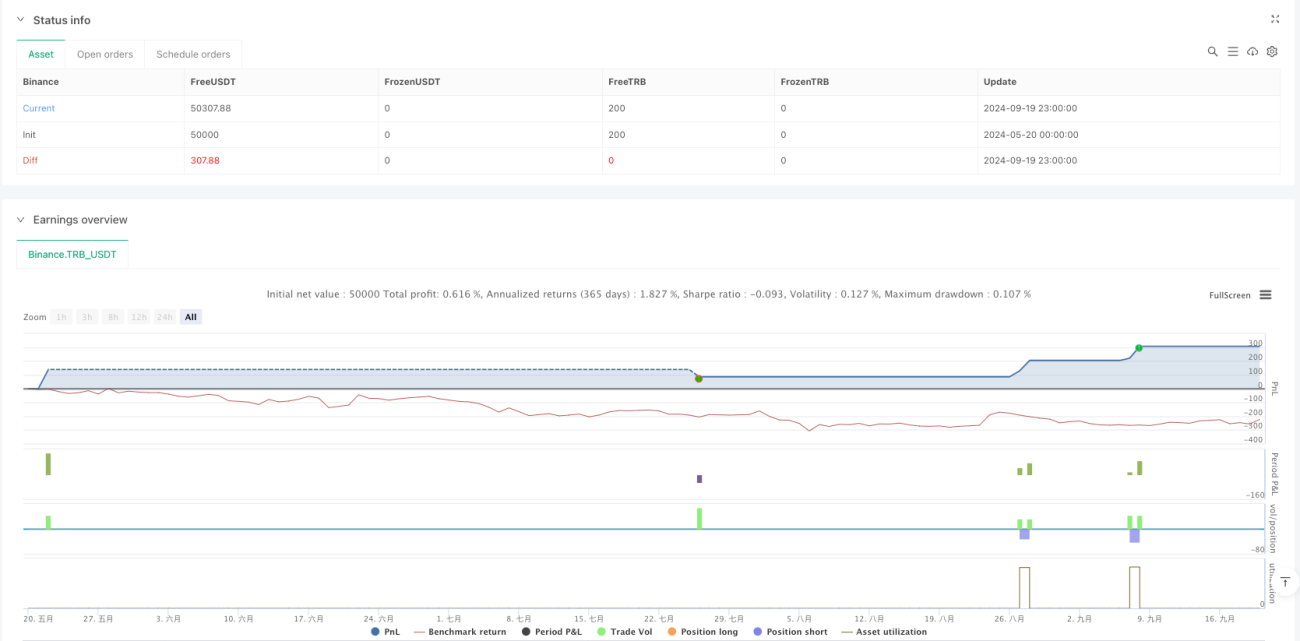
- خطرے پر قابو پانے میں بہتری: فکسڈ اسٹاپ نقصان اور منافع بخش اہداف کو نافذ کیا گیا ہے ، اور روزانہ کی زیادہ سے زیادہ تجارت کی حد کو محدود کیا گیا ہے ، خطرے کی نالی کو مؤثر طریقے سے کنٹرول کیا گیا ہے۔
- منظم آپریشن: حکمت عملی واضح انٹری اور آؤٹ پٹ کی شرائط فراہم کرتی ہے ، جس سے انفرادی فیصلے سے پیدا ہونے والی غیر یقینی صورتحال کو کم کیا جاتا ہے۔
اسٹریٹجک رسک
- مارکیٹ میں اتار چڑھاؤ کا خطرہ: اعلی اتار چڑھاؤ والے بازاروں میں ، غلط بریک سگنل ہوسکتے ہیں ، جس سے تجارت میں نقصان ہوتا ہے۔
- سلائڈ پوائنٹ کا خطرہ: اعلی تعدد ٹریڈنگ ماحول میں ، سلائڈ پوائنٹ کی بڑی لاگت کا سامنا کرنا پڑ سکتا ہے ، جس سے حقیقی منافع متاثر ہوتا ہے۔
- لیکویڈیٹی کا خطرہ: جب مارکیٹ میں لیکویڈیٹی کی کمی ہو تو حجم کی شرائط تجارت کے مواقع کو محدود کرسکتی ہیں۔
- سسٹمیٹک رسک: مارکیٹ کے حالات میں شدید تبدیلیوں کے لئے مقررہ پیرامیٹرز کی ترتیب ممکن نہیں ہے۔
حکمت عملی کی اصلاح کی سمت
- پیرامیٹرز کی متحرک اصلاح: انکولی پیرامیٹرز ایڈجسٹمنٹ میکانزم متعارف کرایا جاسکتا ہے ، جس سے برن بینڈ اور MACD پیرامیٹرز کو مارکیٹ کے حالات کے مطابق خود بخود ایڈجسٹ کیا جاسکتا ہے۔
- مارکیٹ سائیکل کی شناخت: مارکیٹ سائیکل فیصلے کے ماڈیول کو شامل کریں ، مختلف مارکیٹ سائیکلوں میں مختلف تجارتی حکمت عملیوں کا استعمال کریں۔
- خطرے کے انتظام کو بہتر بنانا: متحرک اسٹاپ نقصان کے طریقہ کار کو متعارف کرانے پر غور کیا جاسکتا ہے ، جس میں مارکیٹ میں اتار چڑھاؤ کے مطابق اسٹاپ نقصان کی پوزیشن کو ایڈجسٹ کیا جاسکتا ہے۔
- سگنل فلٹرنگ میں اضافہ: رجحان کی طاقت کے فلٹر کو بڑھانا ، اور افقی مارکیٹ میں زیادہ سے زیادہ ٹریڈنگ سگنل سے بچنا۔
خلاصہ کریں۔
یہ حکمت عملی ایک مکمل تجارتی نظام بناتی ہے جس میں برن بینڈ ریورس سگنل ، MACD ٹرینڈ کی تصدیق اور ٹرانزیکشن کی مقدار کی توثیق کا ایک مجموعہ ہوتا ہے۔ نظام کا بصری ڈیزائن اور سخت رسک کنٹرول اسے خاص طور پر دن کے اندر تجارت کے ل suitable موزوں بناتا ہے۔ اگرچہ مارکیٹ کا کچھ خطرہ موجود ہے ، لیکن اس حکمت عملی کو مستقل طور پر بہتر بنانے اور پیرامیٹرز کو ایڈجسٹ کرنے کے ذریعے مختلف مارکیٹ کے ماحول میں مستحکم کارکردگی کا مظاہرہ کرنے کی امید ہے۔
- 1