جائزہ
یہ حکمت عملی ایک جامع تجارتی نظام ہے جو تکنیکی تجزیہ پر مبنی ہے ، جس میں مزاحمت کے علاقوں کی حمایت ، چارٹ کی شکل اور مارکیٹ کی ساخت کا تجزیہ شامل ہے۔ حکمت عملی اہم قیمت کی سطح کی شناخت ، چارٹ سگنل کی تصدیق اور مجموعی طور پر مارکیٹ کے رجحانات کا جائزہ لینے کے ذریعے تجارتی فیصلے کرتی ہے۔ یہ نظام 1: 3 کے خطرے سے فائدہ اٹھانے کا تناسب استعمال کرتا ہے ، جو پہلے سے طے شدہ اسٹاپ نقصان اور منافع کے اہداف کے ذریعہ خطرے کا انتظام کرتا ہے۔
حکمت عملی کا اصول
اس حکمت عملی کی بنیادی منطق مندرجہ ذیل اہم اجزاء پر مبنی ہے:
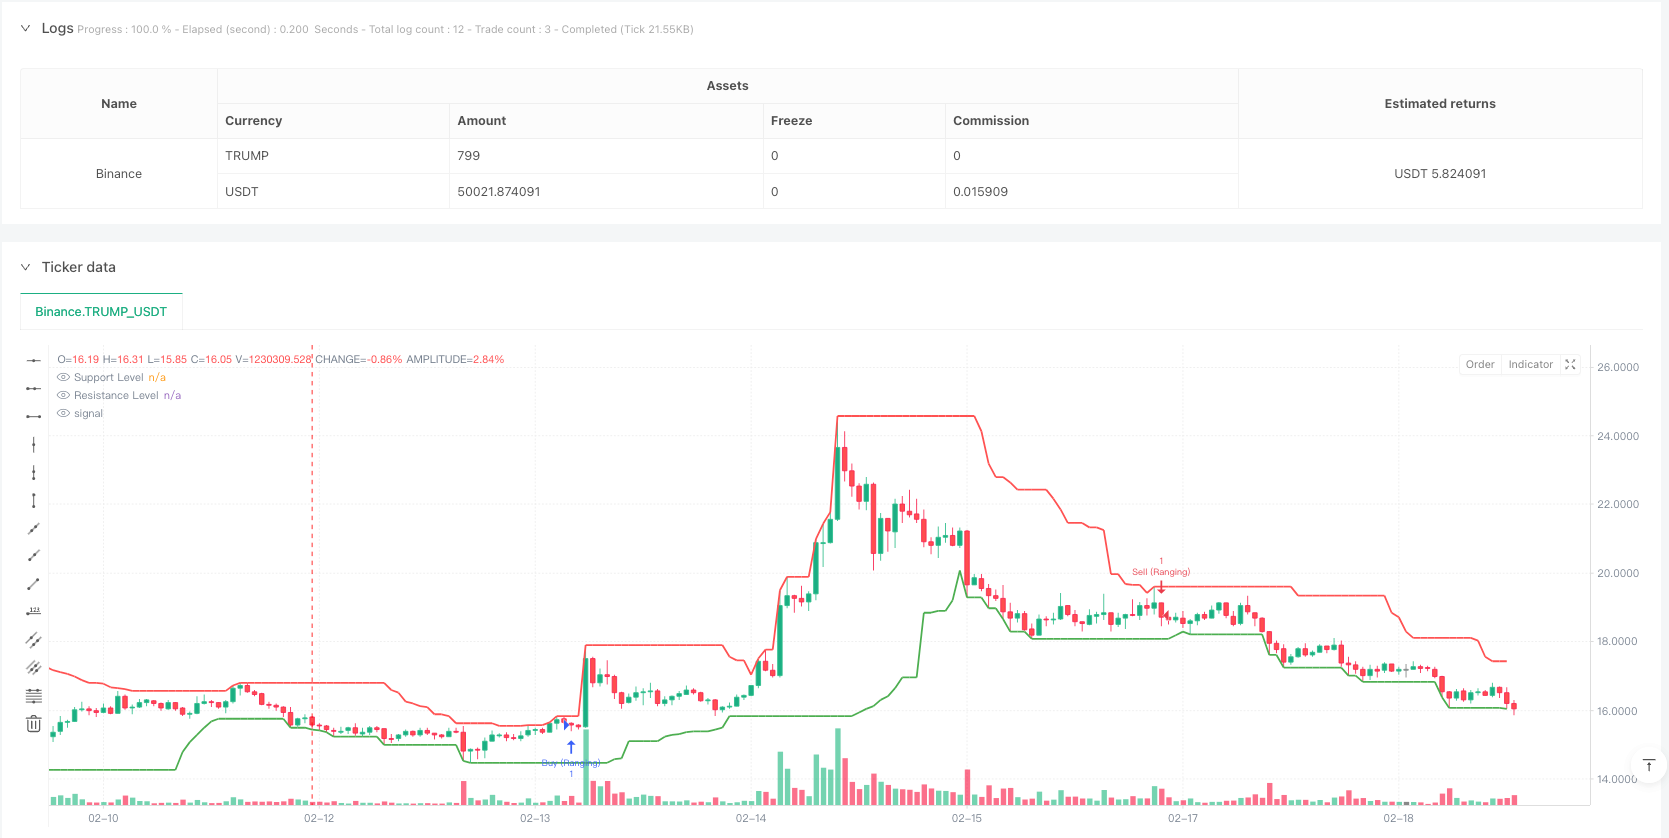
- معاونت اور مزاحمت کے علاقوں کی شناخت - اہم قیمت کی سطح کا تعین کرنے کے لئے پچھلے 20 ادوار کی اعلی ترین اور کم ترین قیمتوں کا استعمال کریں
- گرافک شکل کی توثیق - بشمول عام شکلیں جیسے کہ پوائنٹ انگوٹھے ، پوائنٹ انگوٹھے ، نٹ لائن اور میٹور لائن
- مارکیٹ ڈھانچے کا تجزیہ - مارکیٹ کو اعلی اور کم کے سلسلے میں موازنہ کرکے معلوم کریں کہ آیا یہ بڑھتی ہوئی رجحان ، گرتی ہوئی رجحان ، یا وقفے وقفے سے ہلچل ہے
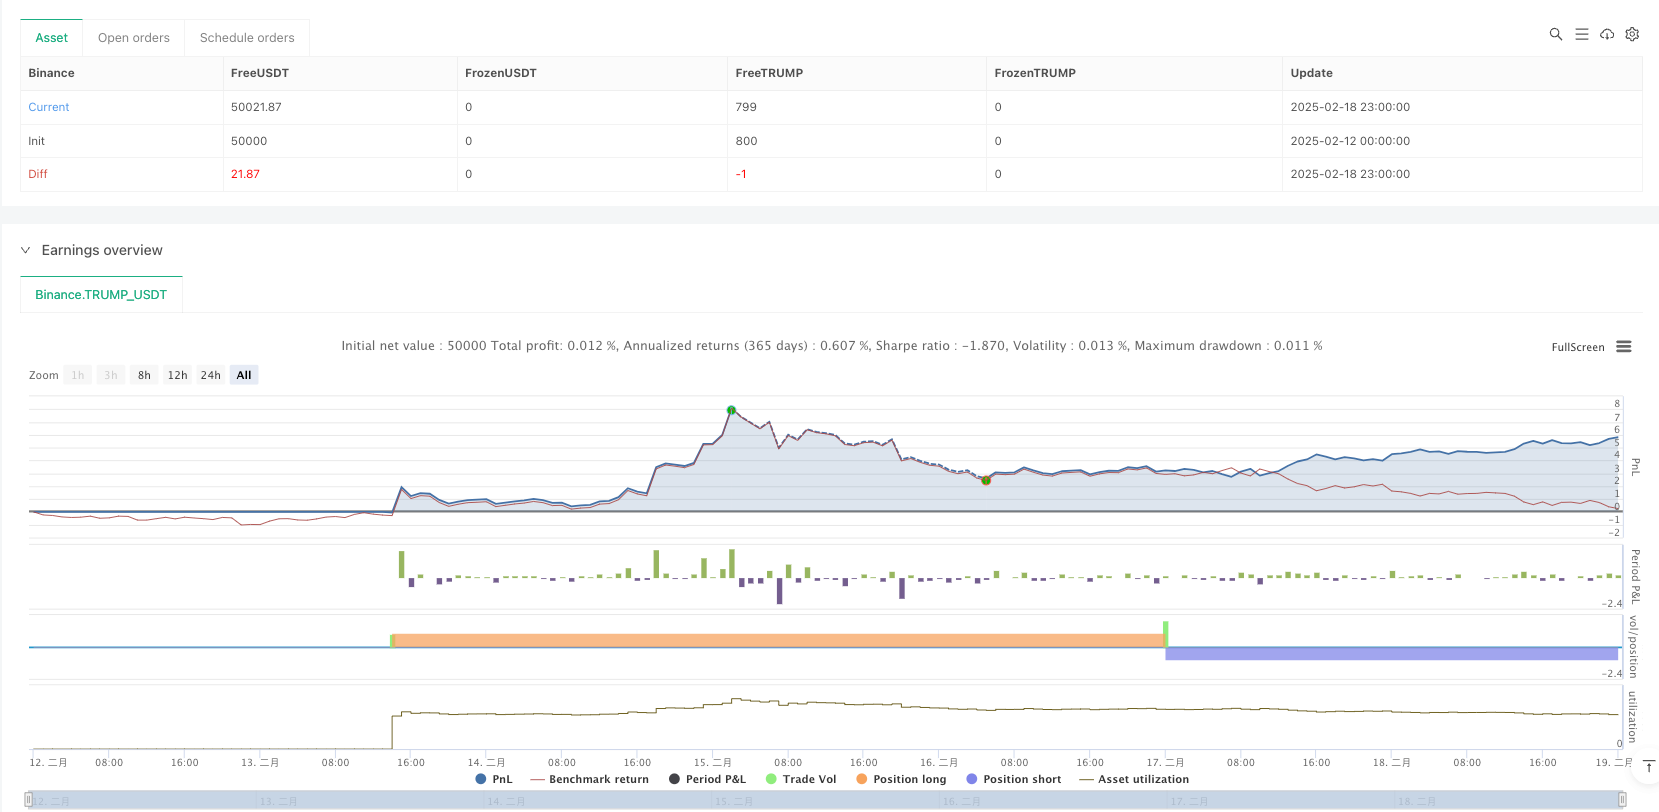
- رسک مینجمنٹ - اسٹاپ پوزیشن کو فکسڈ اسٹاپ لاس پوائنٹس اور 1: 3 رسک کمائی کا تناسب استعمال کرتے ہوئے ترتیب دیں
حکمت عملی تین مارکیٹ کے ماحول میں کام کرتی ہے: رجحان مارکیٹ، وقفہ مارکیٹ اور ٹرانس مارکیٹ، لیکن ہر ماحول کے لئے مختلف تجارتی قواعد کا ایک مجموعہ استعمال کیا جاتا ہے.
اسٹریٹجک فوائد
- کثیر جہتی تجزیہ - قیمتوں کی سطح ، گراف کی شکل اور مارکیٹ کی ساخت کو مربوط کرکے زیادہ قابل اعتماد تجارتی سگنل فراہم کرتا ہے
- لچکدار - رجحانات اور حدود سمیت مختلف مارکیٹ کے حالات کے مطابق ڈھالنے کی صلاحیت
- بہتر خطرے کا انتظام - فکسڈ رسک ٹو ریٹرن استعمال کریں ، اس بات کو یقینی بنائیں کہ ہر تجارت پر واضح خطرے پر قابو پایا جائے
- بصری معاونت - مزاحمت کے علاقوں کو گرافک لیبلنگ کے ذریعہ معاونت فراہم کرنا تاکہ تاجروں کو مارکیٹ کی حالت کو سمجھنے میں مدد ملے۔
اسٹریٹجک رسک
- جعلی توڑنے کا خطرہ - قیمتیں تیزی سے پیچھے ہٹ سکتی ہیں ، جعلی سگنل پیدا کرتی ہیں
- سلائڈ پوائنٹ کا خطرہ - شدید اتار چڑھاؤ کے دوران ، اصل قیمتوں میں توقع سے زیادہ انحراف ہوسکتا ہے
- پیرامیٹرز کی حساسیت - معاون مزاحمت کا دورانیہ ، مارکیٹ کی ساخت کا دورانیہ وغیرہ جیسے پیرامیٹرز کا انتخاب حکمت عملی کی کارکردگی کو نمایاں طور پر متاثر کرتا ہے
- مارکیٹ کے ماحول پر انحصار - تیزی سے ایک طرفہ رجحانات یا شدید اتار چڑھاؤ والے بازاروں میں خراب کارکردگی کا مظاہرہ کرسکتا ہے
حکمت عملی کی اصلاح کی سمت
- متحرک پیرامیٹر ایڈجسٹمنٹ - مارکیٹ میں اتار چڑھاؤ کے مطابق خود کار طریقے سے ایڈجسٹ سپورٹ اور مزاحمت کے علاقوں کے لئے حساب کتاب کی مدت
- فلٹر بڑھاوا - جعلی بریک سگنل کو فلٹر کرنے کے لئے ٹرانزٹ ، اتار چڑھاؤ کی شرح اور دیگر اشارے شامل کریں
- اسٹاپ نقصان کی اصلاح - اے ٹی آر پر مبنی متحرک اسٹاپ نقصان کی ترتیبات کو مارکیٹ میں اتار چڑھاؤ کے ل for بہتر موافقت
- ٹائم فریم کی توثیق - سگنل کی وشوسنییتا کو بڑھانے کے لئے کثیر ٹائم فریم تجزیات متعارف کرایا
- پوزیشن مینجمنٹ کو بہتر بنانا - مارکیٹ میں اتار چڑھاو اور سگنل کی طاقت کی بنیاد پر پوزیشن ہولڈنگ کے سائز کو متحرک طور پر ایڈجسٹ کرنا
خلاصہ کریں۔
اس حکمت عملی میں متعدد تکنیکی تجزیاتی ٹولز کا مجموعی استعمال کرکے ایک مکمل تجارتی نظام بنایا گیا ہے۔ اس کا فائدہ کثیر جہتی تجزیہ اور بہتر خطرے کے انتظام میں ہے ، لیکن اس کے ساتھ ہی اس میں جعلی پیشرفت اور پیرامیٹرز کی حساسیت جیسے چیلنجوں کا بھی سامنا کرنا پڑتا ہے۔ تجویز کردہ اصلاح کی سمت کے ذریعہ ، اس حکمت عملی میں موجودہ فوائد کو برقرار رکھنے کی بنیاد پر استحکام اور موافقت کو مزید بڑھانے کی امید ہے۔ اس حکمت عملی کو کامیابی کے ساتھ لاگو کرنے کے لئے ، تاجروں کو ہر جزو کی گہری تفہیم کی ضرورت ہے اور مارکیٹ کی اصل صورتحال کے مطابق مناسب پیرامیٹرز کو ایڈجسٹ کریں۔
/*backtest
start: 2025-02-12 00:00:00
end: 2025-02-19 00:00:00
period: 1h
basePeriod: 1h
exchanges: [{"eid":"Binance","currency":"TRUMP_USDT"}]
*/

//@version=5
strategy("Support/Resistance Strategy with Candlestick Confirmation, Market Structure, and 1:3 R:R", overlay=true)

// Input parameters
supportResistancePeriod = input.int(20, title="Support/Resistance Period", minval=1)
stopLossPips = input.int(50, title="Stop Loss (in pips)", minval=1)
takeProfitRatio = input.float(3.0, title="Risk-to-Reward Ratio", minval=1.0)
structurePeriod = input.int(20, title="Market Structure Period", minval=1)  // Period to determine market structure

// Function to calculate support level (lowest low in the period)
getSupportLevel() =>
    ta.lowest(low, supportResistancePeriod)

// Function to calculate resistance level (highest high in the period)
getResistanceLevel() =>
    ta.highest(high, supportResistancePeriod)

// Get the support and resistance levels
supportLevel = getSupportLevel()
resistanceLevel = getResistanceLevel()

// Function to detect market structure
isBullishTrend() =>
    high[structurePeriod] > high[structurePeriod+1] and low[structurePeriod] > low[structurePeriod+1]

isBearishTrend() =>
    high[structurePeriod] < high[structurePeriod+1] and low[structurePeriod] < low[structurePeriod+1]

isRanging() =>
    not isBullishTrend() and not isBearishTrend()

// Candlestick Pattern Detection Functions
isBullishEngulfing() =>
    close[1] < open[1] and close > open and close > open[1] and open < close[1]

isBearishEngulfing() =>
    close[1] > open[1] and close < open and close < open[1] and open > close[1]

isDoji() =>
    math.abs(close - open) <= (high - low) * 0.1

isHammer() =>
    body = math.abs(close - open)
    upperShadow = high - math.max(close, open)
    lowerShadow = math.min(close, open) - low
    body <= (high - low) * 0.3 and lowerShadow > body * 2 and upperShadow <= body * 0.5

isShootingStar() =>
    body = math.abs(close - open)
    upperShadow = high - math.max(close, open)
    lowerShadow = math.min(close, open) - low
    body <= (high - low) * 0.3 and upperShadow > body * 2 and lowerShadow <= body * 0.5

// Conditions for Buy and Sell based on candle close
buyCondition = (isBullishEngulfing() or isHammer()) and close > supportLevel
sellCondition = (isBearishEngulfing() or isShootingStar()) and close < resistanceLevel

// Define buy/sell conditions based on market structure
bullishMarket = isBullishTrend() and buyCondition
bearishMarket = isBearishTrend() and sellCondition
rangingMarket = isRanging() and (buyCondition or sellCondition)

// Calculate the Stop Loss and Take Profit Levels
longStopLoss = supportLevel - (stopLossPips * syminfo.mintick)
shortStopLoss = resistanceLevel + (stopLossPips * syminfo.mintick)

// Calculate R:R based Take Profit Levels
longTakeProfit = close + (math.abs(close - longStopLoss) * takeProfitRatio)
shortTakeProfit = close - (math.abs(close - shortStopLoss) * takeProfitRatio)

// Plotting Support and Resistance Lines
plot(supportLevel, color=color.green, linewidth=2, title="Support Level", style=plot.style_line)
plot(resistanceLevel, color=color.red, linewidth=2, title="Resistance Level", style=plot.style_line)

// Strategy: Buy on Support, Sell on Resistance with candlestick confirmation and market structure
if (bullishMarket)
    strategy.entry("Buy", strategy.long, stop=longStopLoss, limit=longTakeProfit)

if (bearishMarket)
    strategy.entry("Sell", strategy.short, stop=shortStopLoss, limit=shortTakeProfit)

if (rangingMarket)
    if (buyCondition)
        strategy.entry("Buy (Ranging)", strategy.long, stop=longStopLoss, limit=longTakeProfit)
    if (sellCondition)
        strategy.entry("Sell (Ranging)", strategy.short, stop=shortStopLoss, limit=shortTakeProfit)

// Optional: Highlighting the zones for support and resistance
bgcolor(close > resistanceLevel ? color.new(color.red, 90) : na, title="Resistance Zone")
bgcolor(close < supportLevel ? color.new(color.green, 90) : na, title="Support Zone")